Azure Demand Forecasting Template
The Azure Demand Forecasting diagram will show the architecture of a demand forecast, making it easier for you to predict data consumption, costs, and forecast results.
Available on Enterprise, Business, Education plans.
About the Azure Demand Forecasting
The Azure Demand Forecasting diagram will show the architecture of a demand forecast, making it easier for you to predict data consumption, costs, and forecast results. Azure is Microsoft’s cloud computing platform, designed to provide cloud-based services such as remote storage, database hosting, and centralized account management.
Keep reading to learn more about the Azure Demand Forecasting Template.
What is an Azure Demand Forecasting Template
The Azure Demand Forecasting Template, like any other diagram, visually shows the necessary steps for demand forecasting. The Azure Demand Forecasting Template has unique icons categorized into Stencils. Each Stencil focuses on a specific task to make it easier for users to access the right set of icons.
When to use Azure Demand Forecasting Template
You can use the Azure Demand Forecasting Template to predict demand for a product in a retail/online store, forecast hospital visits, and anticipate power consumption.
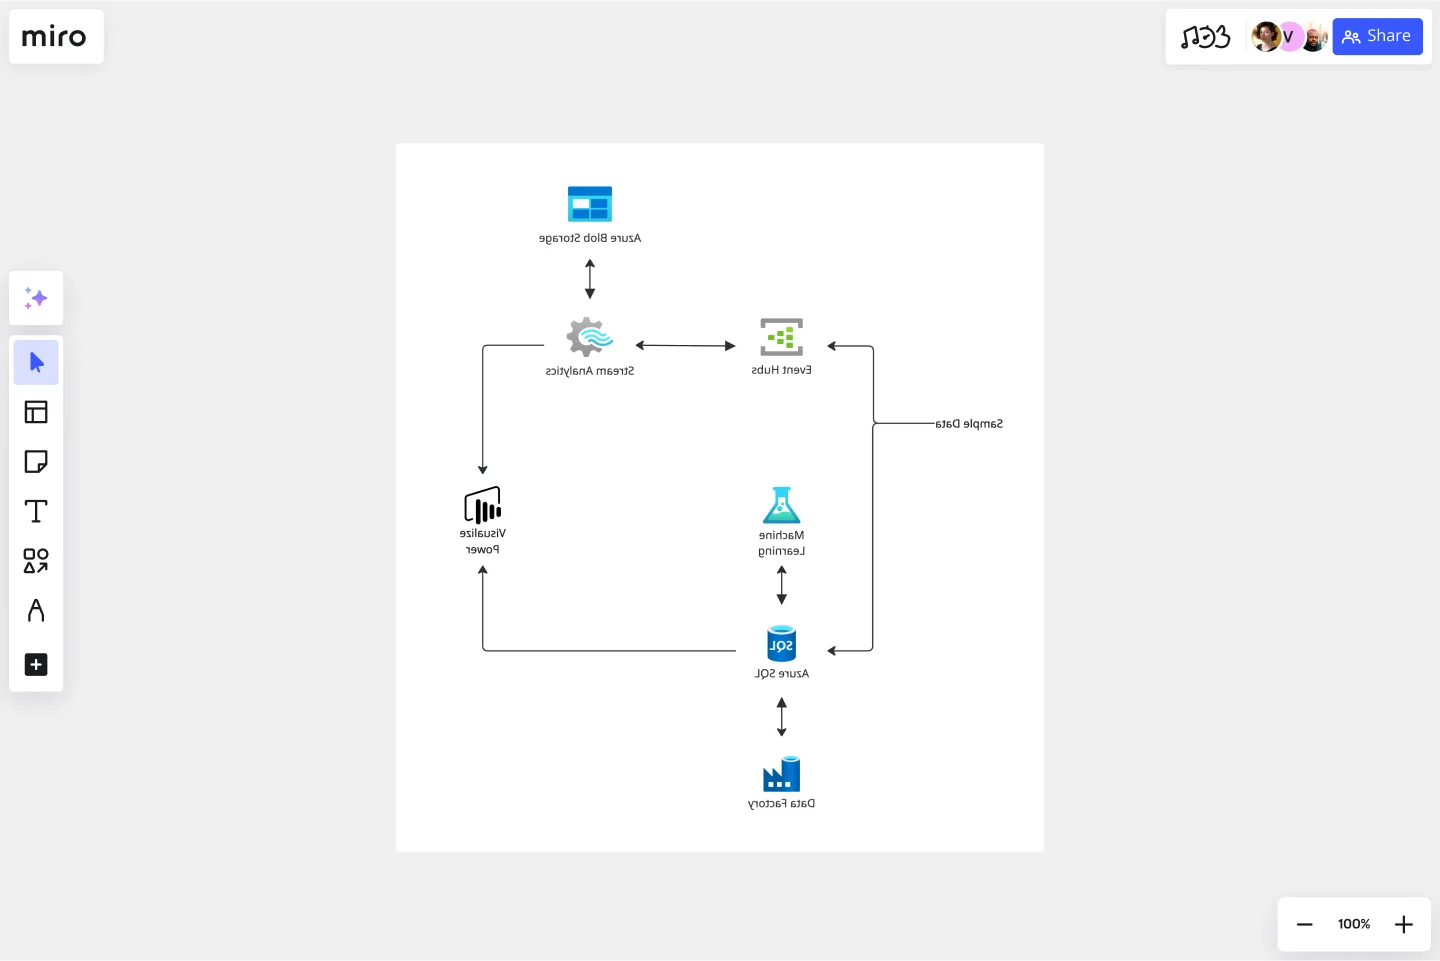
The Azure Demand Forecasting Template combines several Azure services to provide actionable predictions:
Event Hubs collects real-time consumption data.
Stream Analytics aggregates the streaming data and makes it available for visualization.
Azure SQL Database stores and transforms the consumption data.
Machine Learning implements and executes the forecasting model.
Power BI visualizes the real-time energy consumption and the forecast results.
Finally, Data Factory orchestrates and schedules the entire data flow.
How-To Section:
Here are some of the Stencils and their meaning when implementing the Azure Demand Forecasting Template:
How do I make an Azure Demand Forecasting Template?
To make an Azure Demand Forecasting in Miro is easy. You can use our Azure Demand Forecasting Template and customize it as you see fit. Once you have the diagram structure, you can start adding the icons. You can find the icons under our Azure Icon Set integration.
Get started with this template right now. Available on Enterprise, Business, Education plans.
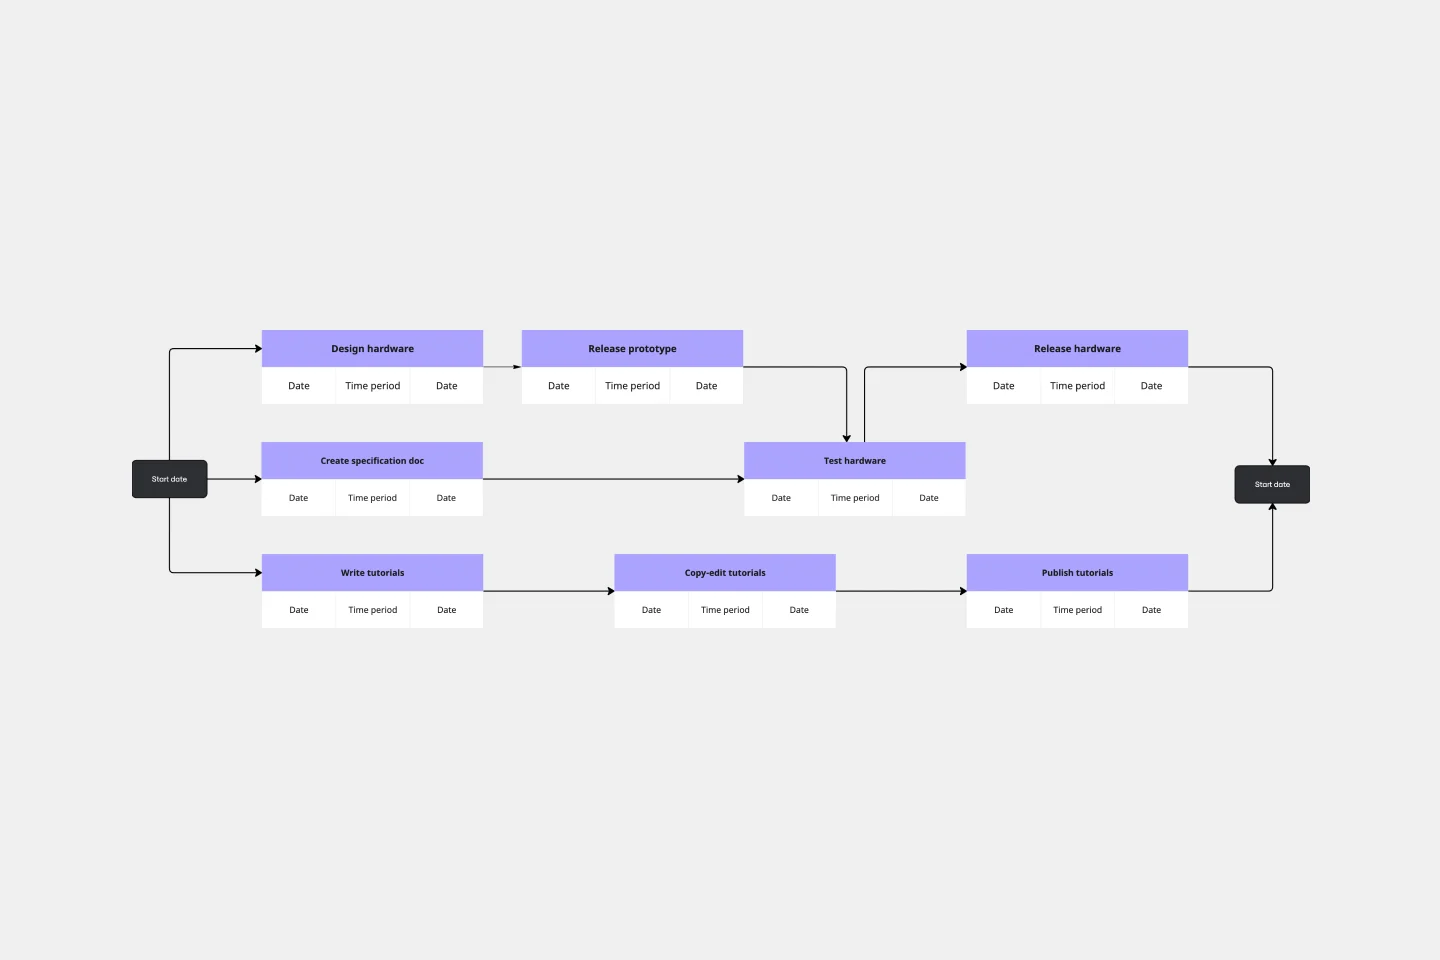
PERT Chart Template
Works best for:
Mapping, Project Planning
A Program Evaluation and Review Technique (PERT) diagram is used to plan projects efficiently. They help you set a clear timeline, plan out tasks and dependencies, and determine a critical path.
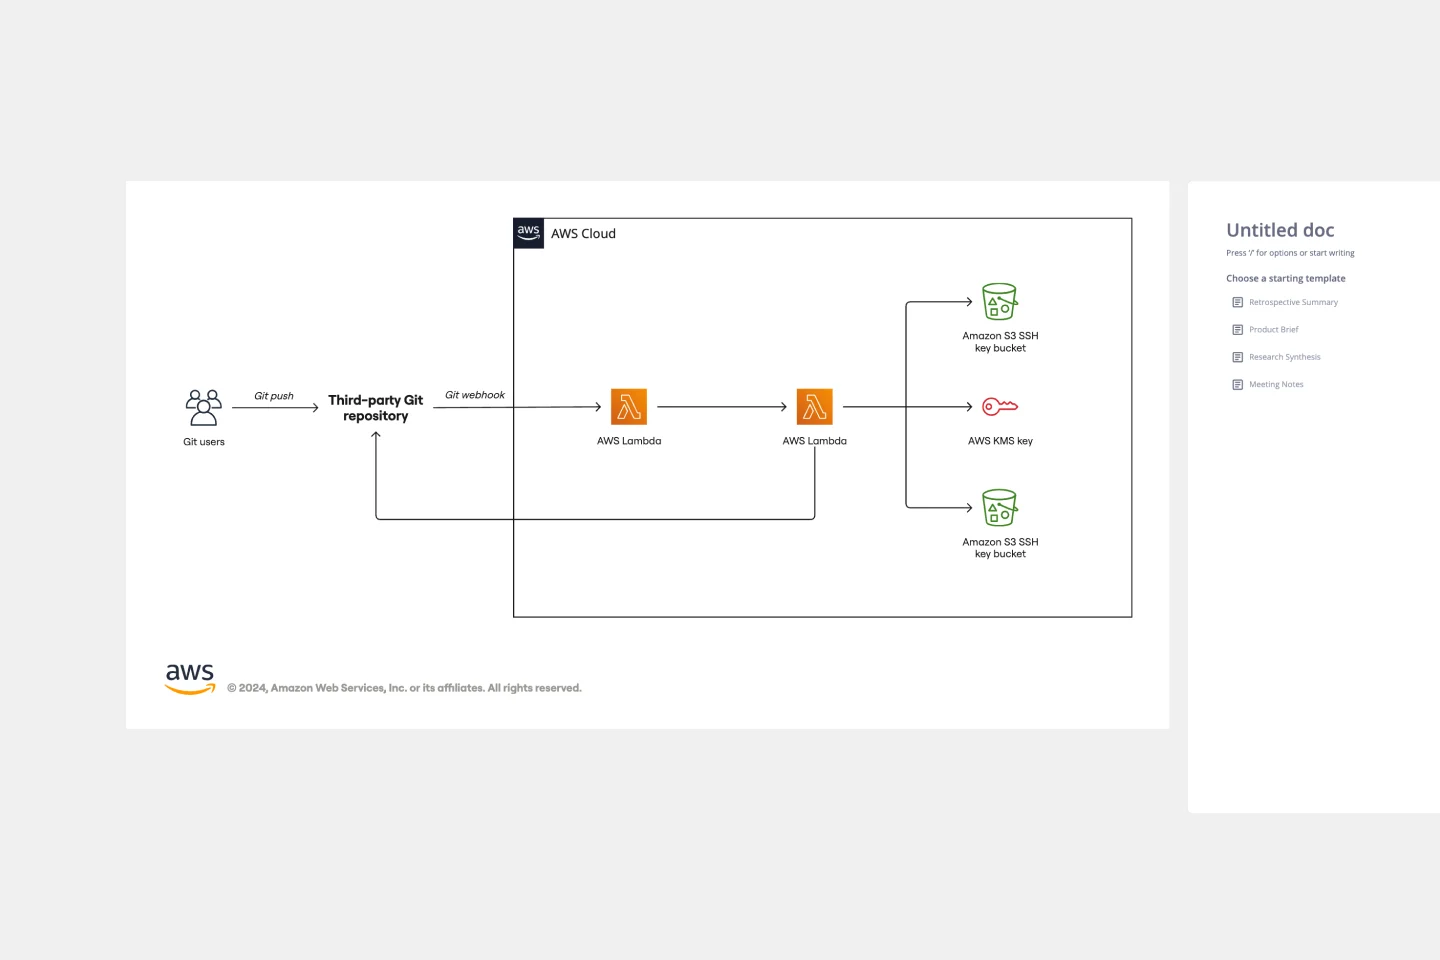
AWS Git to S3 Webhooks Template
Works best for:
Software Development, Diagrams
The AWS Git to S3 Webhooks Template is a visual representation of Git webhooks with AWS services Quick Start architecture. You can now have an overview of your AWS architecture with Miro’s AWS Git to S3 Webhooks Template, track your cloud solutions easily, and optimize processes like never before.
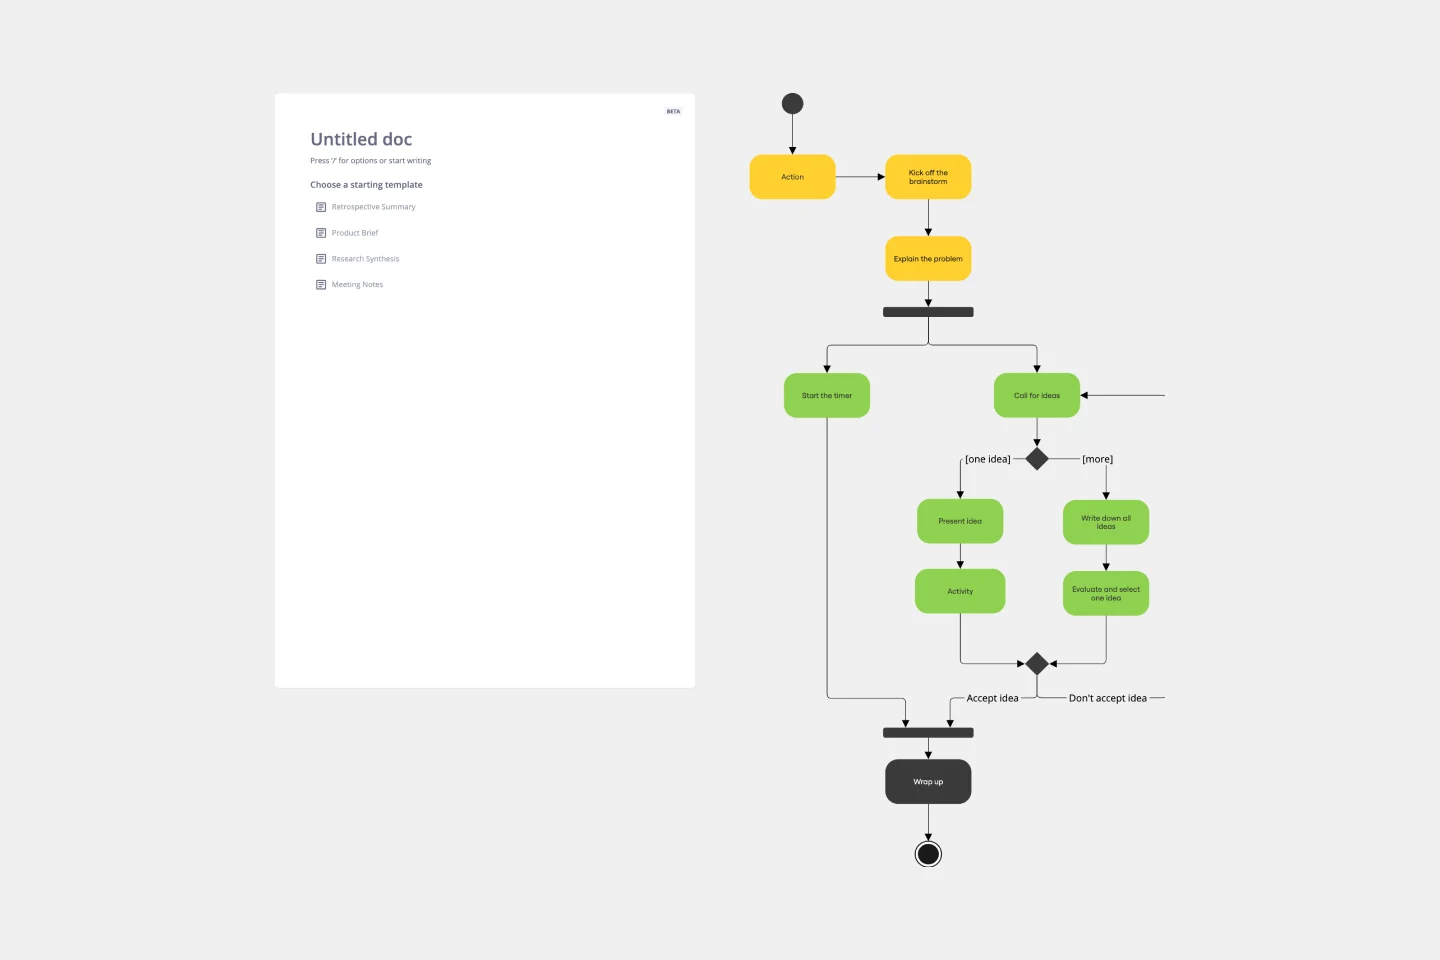
UML Activity Diagram Template
Works best for:
Diagrams
Use our Activity Diagram template to break down activities into smaller decisions and subprocesses. Improve and optimize systems and processes in I.T., business management, and more.
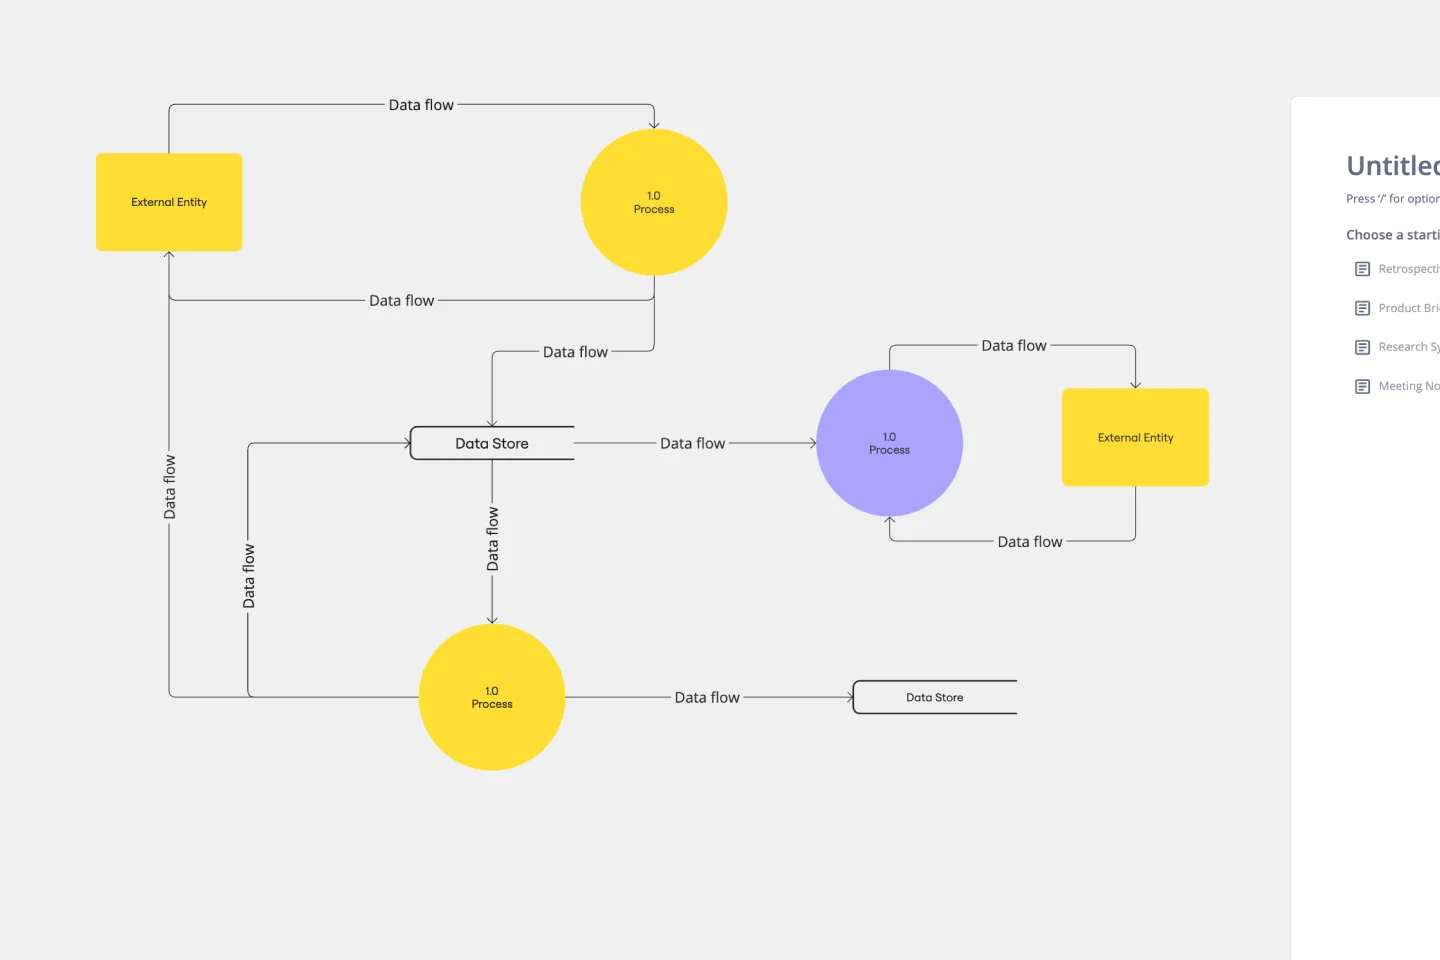
Data Flow Diagram Template
Works best for:
Flowcharts, Software Development, Diagrams
Any process can get pretty complex, especially when it has multiple components. Get a better grasp of your process through a data flow diagram (DFD). DFDs create a simple visual representation of all components in the flow of data and requirements in an entire system. They’re most often used by growth teams, data analysts, and product teams, and they’re created with one of three levels of complexity—0, 1, or 2. This template will help you easily build the best DFD for your process.
Opportunity Solution Tree
Works best for:
Diagramming
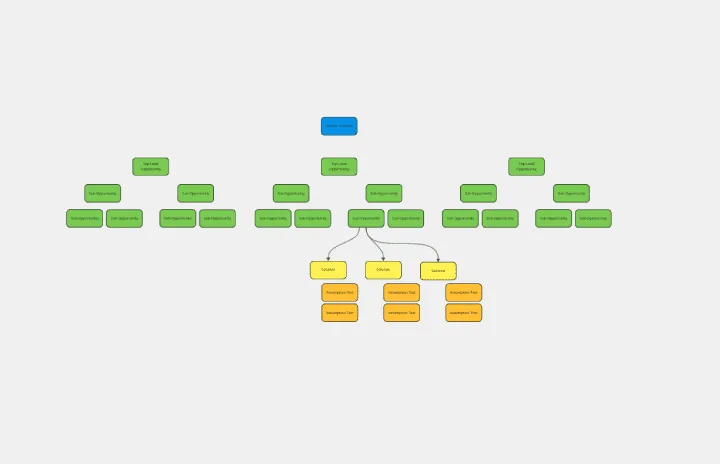
The Opportunity Solution Tree template is a visual tool for identifying and prioritizing opportunities and solutions. It provides a structured framework for mapping customer needs, pain points, and potential solutions. This template enables teams to explore divergent ideas, evaluate alternatives, and focus on high-impact solutions. By promoting customer-centricity and innovation, the Opportunity Solution Tree empowers teams to address market needs effectively and deliver value-driven solutions.
Datavant Switchboard with AWS Clean Rooms Template
Works best for:
AWS
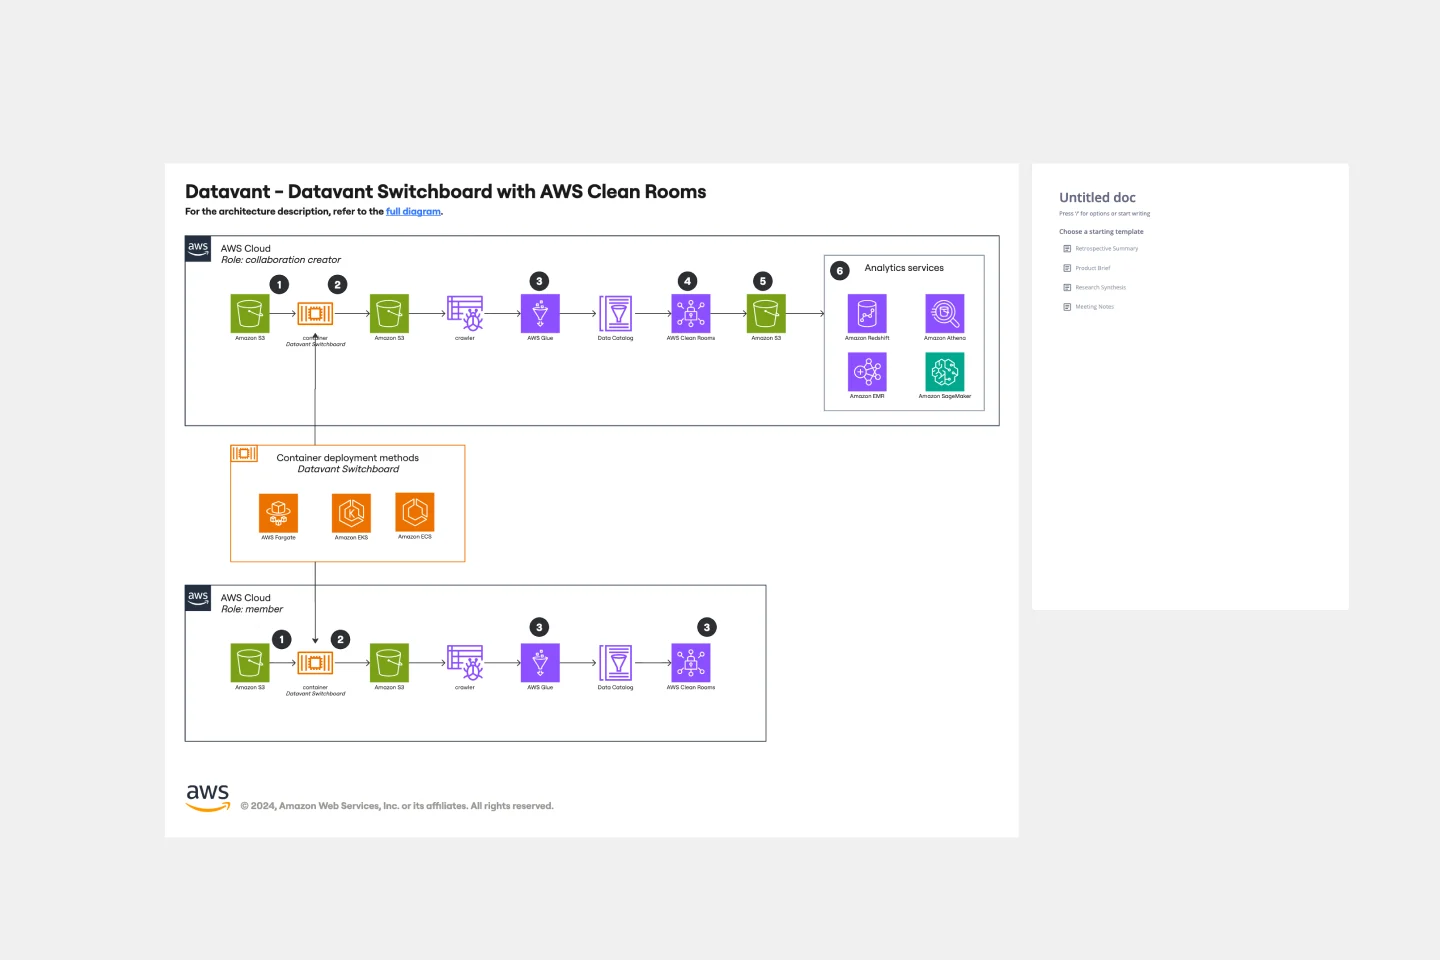
The AWS Datavant Switchboard Clean Rooms Template integrates health data sources using Datavant's secure data connection capabilities and AWS Clean Rooms' scalable data processing environment. It's useful for professionals in engineering, database management, and development. The customizable Miro interface streamlines secure and efficient data handling and team collaboration for a wide range of projects.