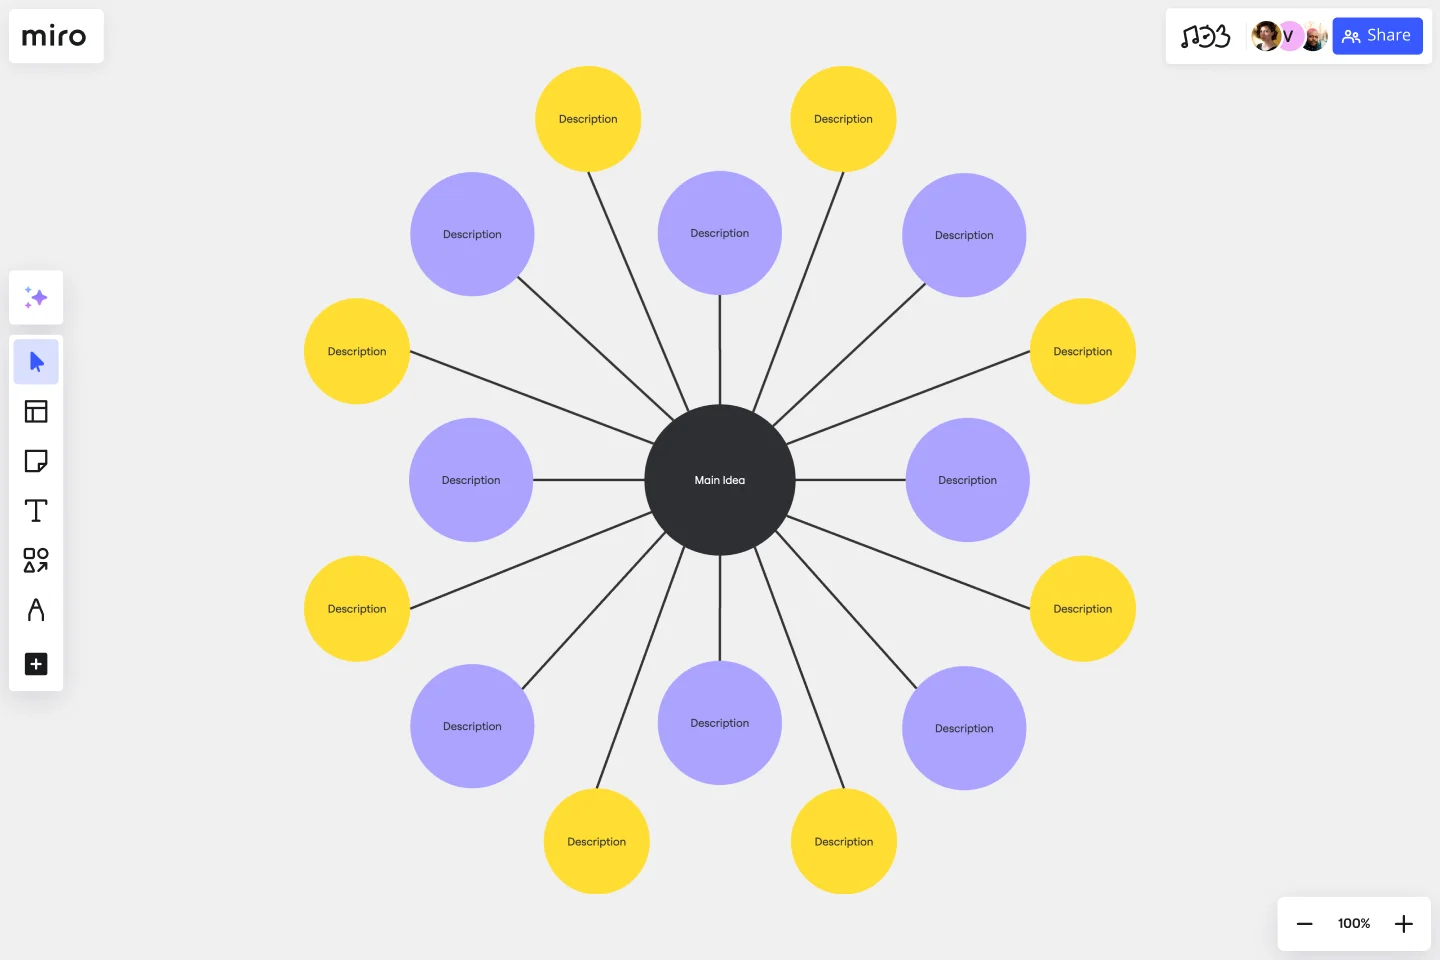
Bubble Map Template
Map ideas and data points quickly with a Bubble Map Template. Streamline complex information, promoting efficient decision-making in every project across your organization.
About the Bubble Map Template
The Bubble Map Template stands out in data visualization and idea organization as an adaptable and easy-to-use tool. It allows you to arrange your thoughts, processes, or data in a visually appealing and understandable format, boosting efficiency and clarity. Whether brainstorming, strategizing, or presenting, use the Bubble Map Template as your go-to solution for turning complex ideas into clear visual narratives.
What's a Bubble Map Template?
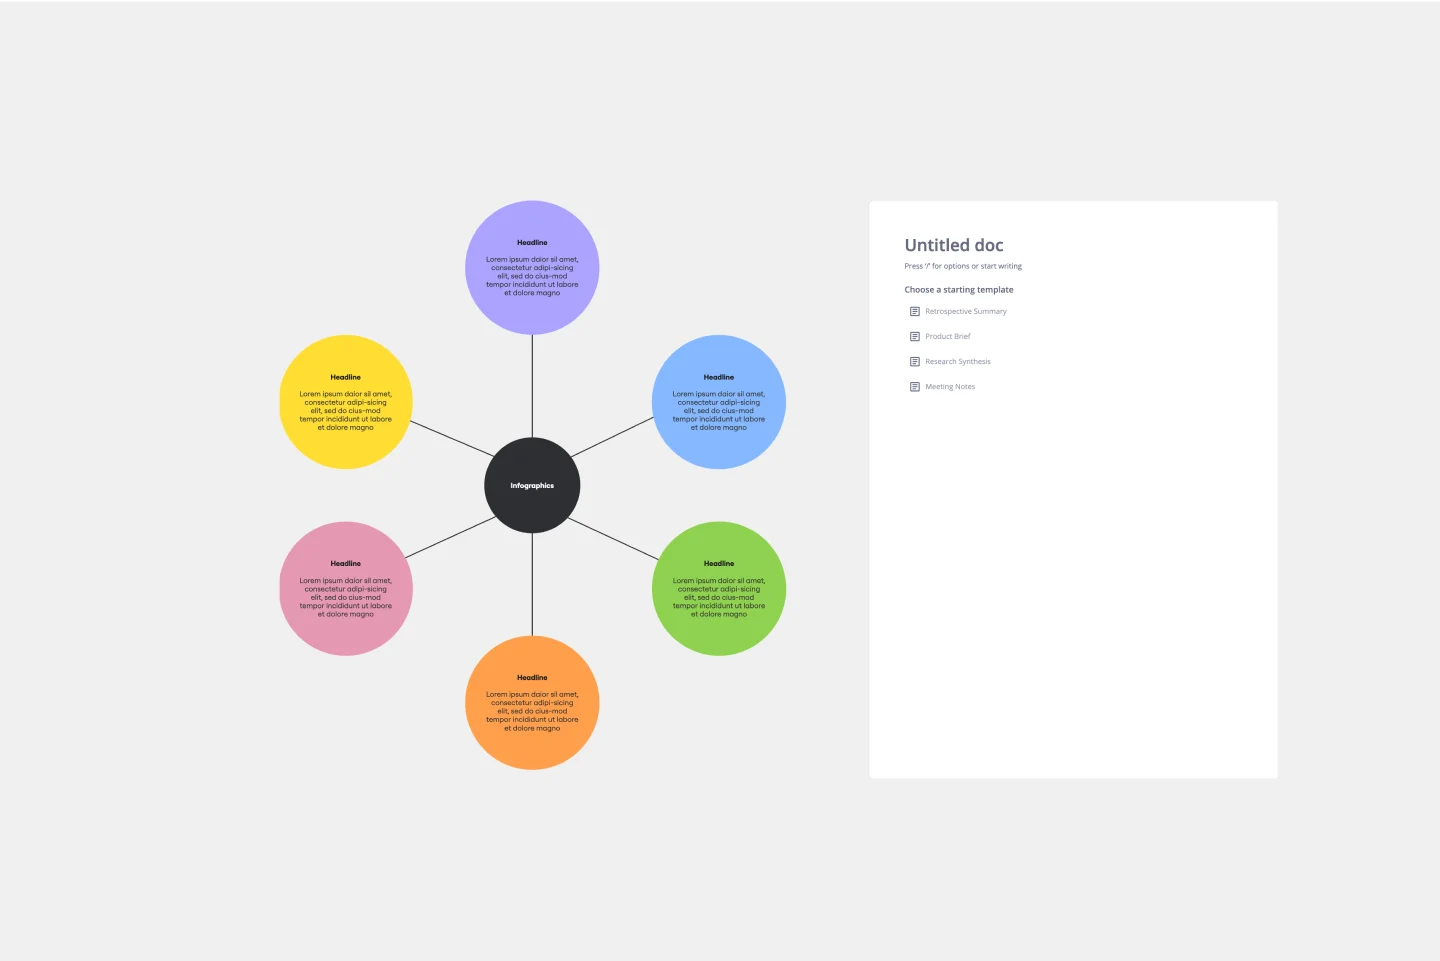
A Bubble Map Template is a diagramming tool used for visually organizing information. The diagram uses varying-sized circles or "bubbles" to represent concepts and lines to denote relationships or connections between them. It's a great tool for understanding complex systems, brainstorming ideas, or visualizing hierarchies and relationships.
Why should you use it?
Bubble maps help streamline thoughts, ideas, and information in an easily digestible format. They encourage critical thinking and facilitate understanding of relationships and patterns within complex data.
How to use a Bubble Map Template in Miro?
The Bubble Map Template in Miro offers a streamlined way to visually organize your ideas or data. Here's a quick guide to creating your Bubble Map:
Select the Bubble Map Template: Click on "Use template." The template will then be loaded onto your Miro board.
Edit the bubbles: Click on the template, and a text box will appear in the context menu bar. This will allow you to edit the central bubble or main idea. For resizing, click and drag the circle's edge. In the context menu, change the color of the bubbles and lines, adjust the font size and style within the bubbles, and even add icons or images to make your bubble map more visually engaging.
Auto-arrange and align: If you're dealing with many bubbles, Miro's auto-arrange and align feature can help you keep your map neat and readable.
Remember that you can invite others to collaborate on your bubble map in real-time, making it the ultimate bubble map maker and an excellent tool for brainstorming sessions, project planning, or team meetings. Enjoy visually mapping your thoughts and ideas with Miro's Bubble Map Template.
Can I collaborate with my team on a Bubble Map in real time?
Yes. Miro's collaborative features allow multiple users to work on the same Bubble Map simultaneously. Team members can add their input, make changes, and leave comments in real time, promoting dynamic and efficient collaboration.
Can I share my Bubble Map with others?
Absolutely. Miro lets you share your Bubble Map in several ways – via a link, email, or even embedded on a website. You can control whether recipients can view, comment or edit your map.
Can I use the Bubble Map Template offline?
Miro primarily operates online to enable real time collaboration. However, you can export your Bubble Map Template as a PNG, JPEG, or PDF file to view offline.
Get started with this template right now.
Onion Diagram Template
Works best for:
Diagramming, Mapping and Diagramming
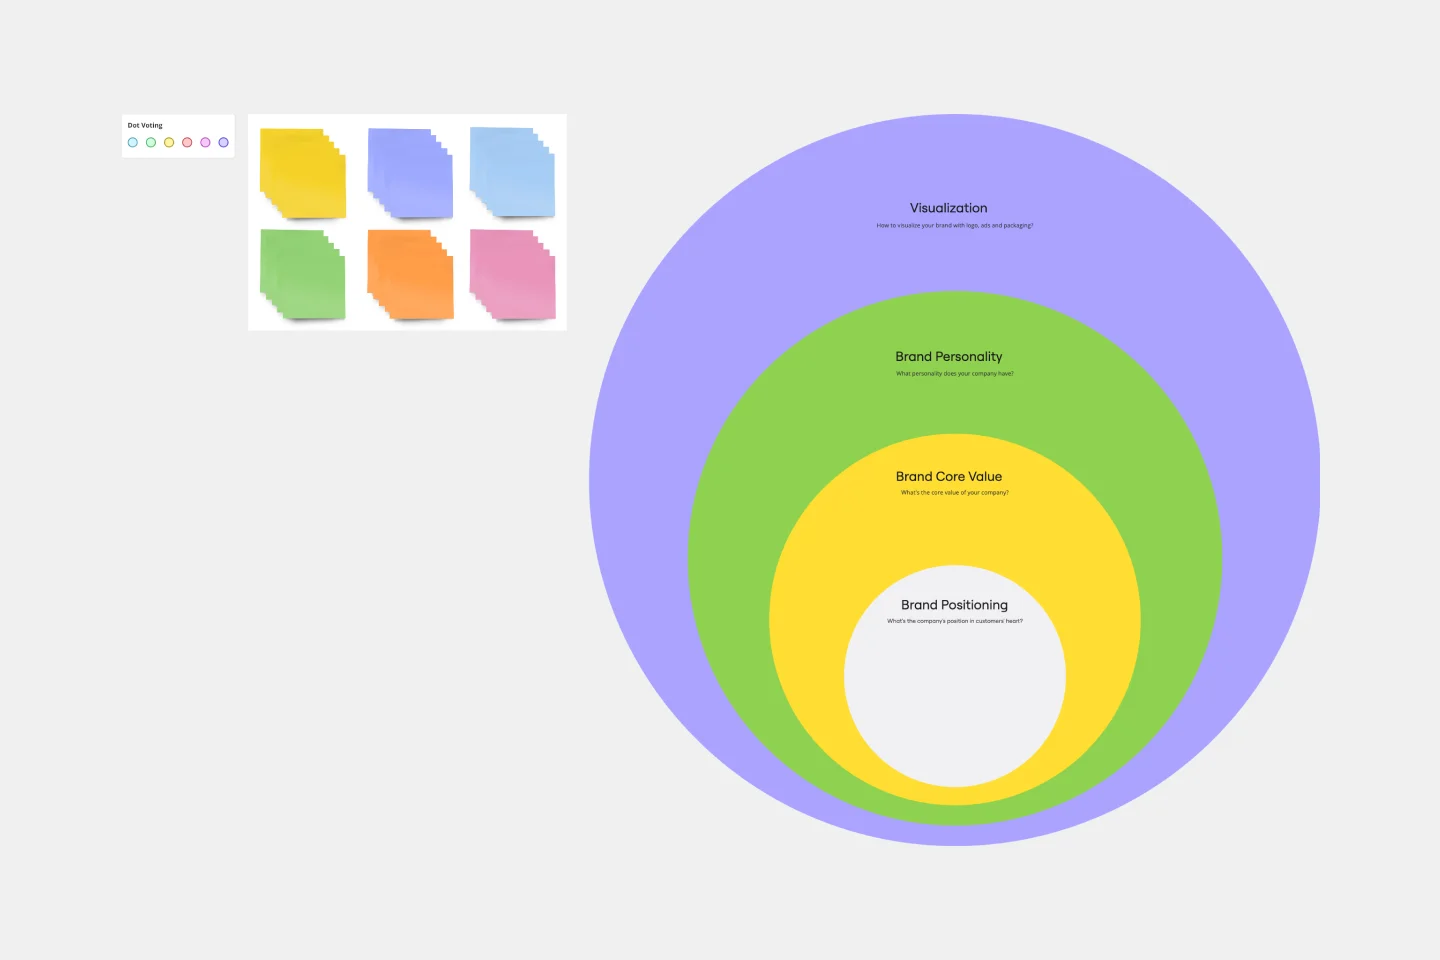
The Onion Diagram Template is a distinct tool designed to visually represent layers of a specific concept, system, or process, akin to the layers of an onion. Each concentric layer of the diagram provides insights into a different aspect or phase of the topic at hand, moving from the core foundational element outwards to more peripheral components. One of the prime benefits of this template is its ability to offer hierarchical clarity. Users can immediately discern the importance, sequence, or interrelation of different elements within a system, facilitating enhanced comprehension and efficient decision-making.
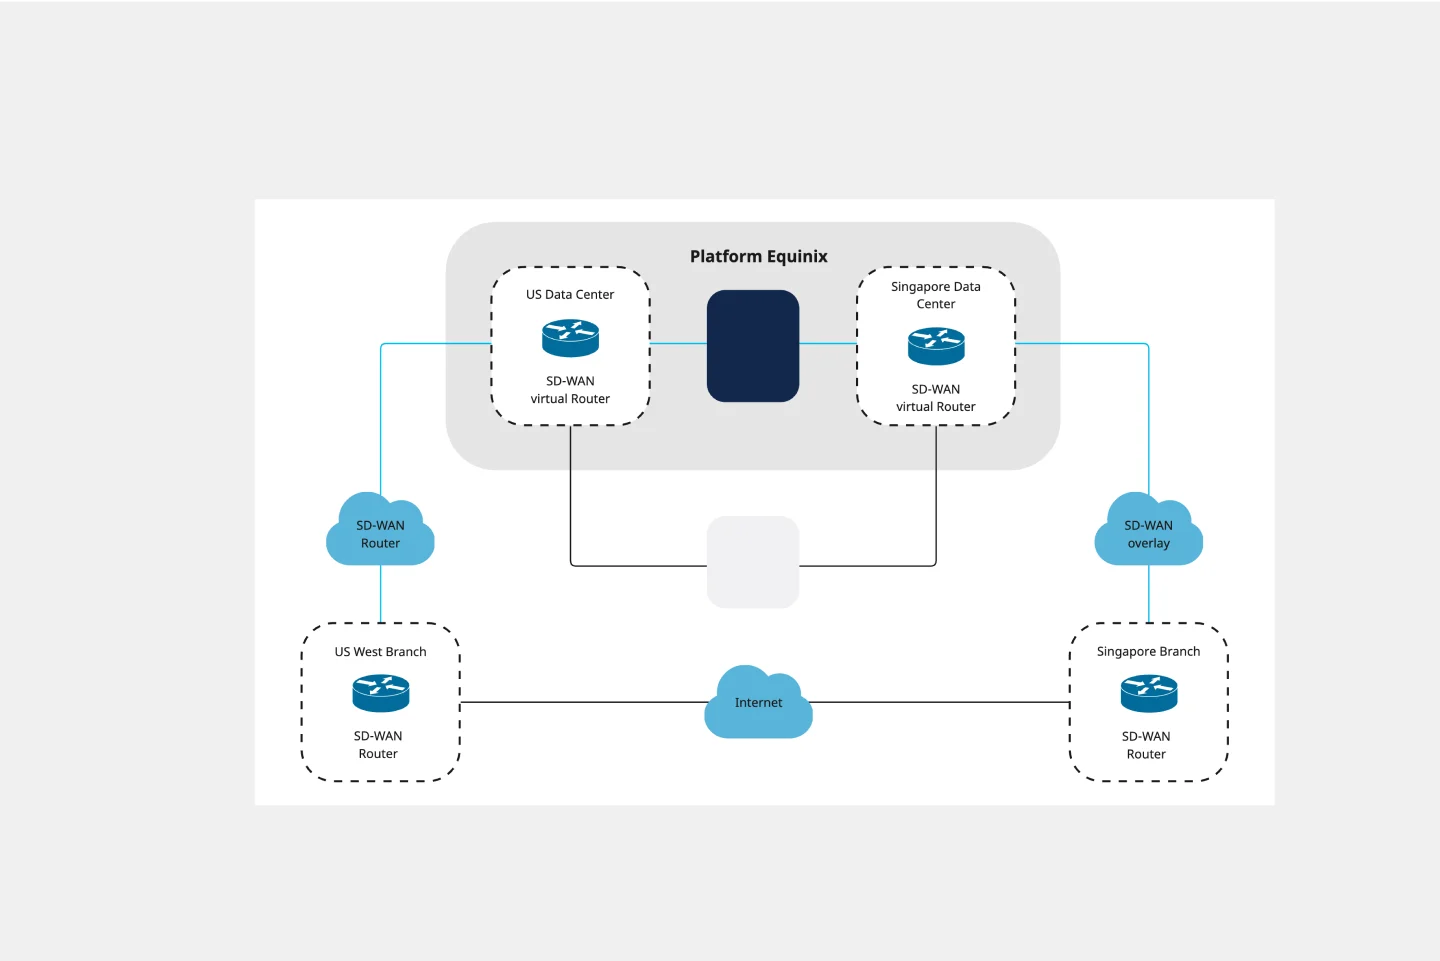
Cisco Data Network Diagram Template
Works best for:
Software Development
Cisco offers data center and access networking solutions built for scale with industry-leading automation, programmability, and real-time visibility. The Cisco Data Network Diagram uses Cisco elements to show the network design of Cisco Data Networks visually.
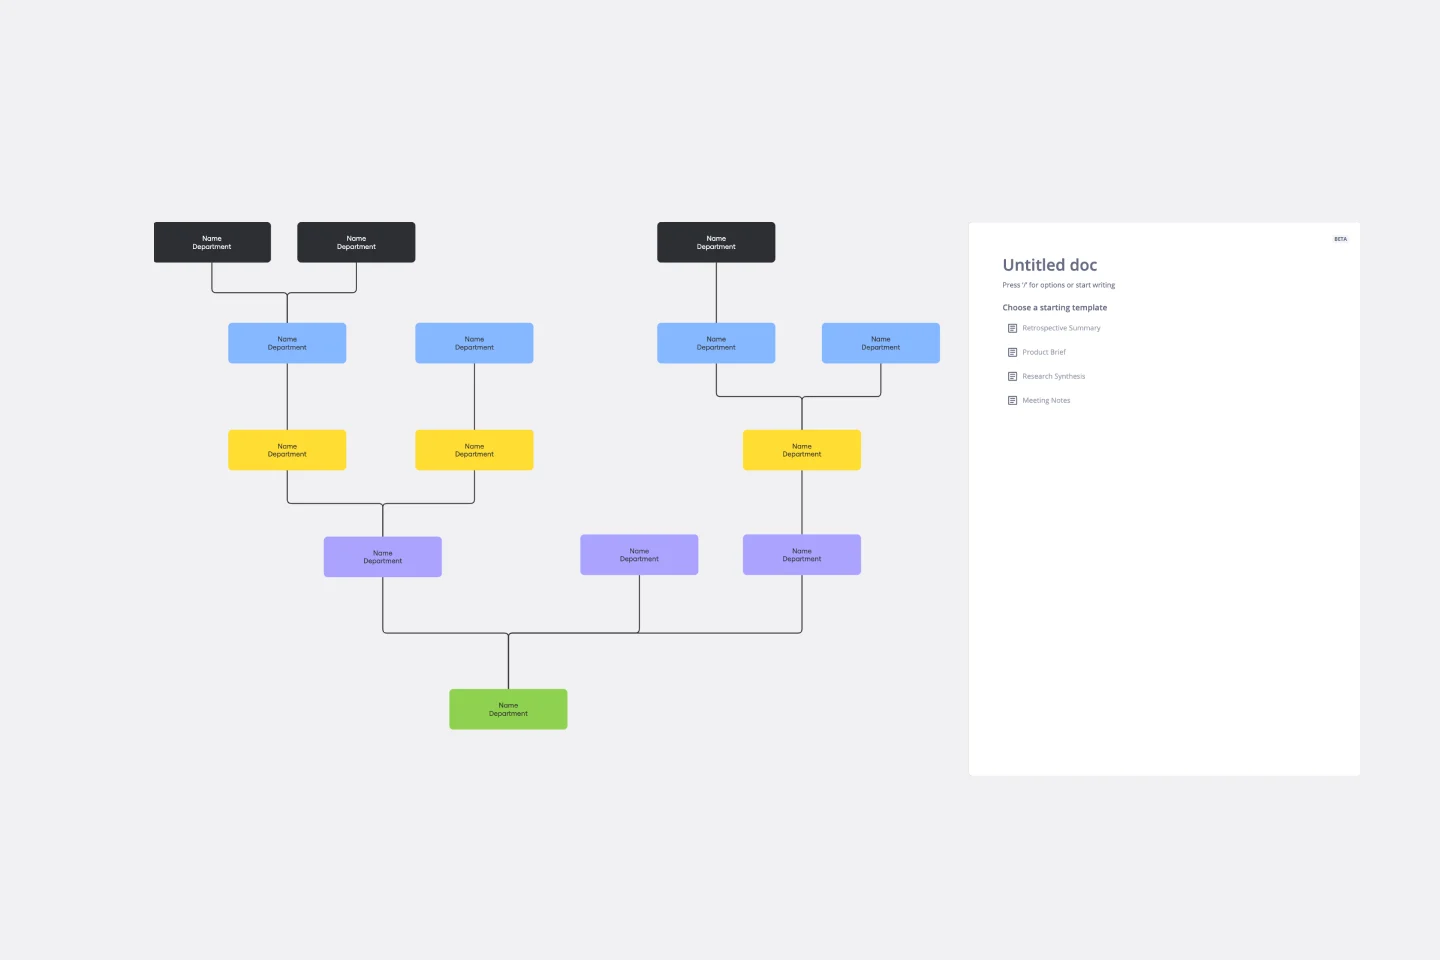
Inverted Org Chart Template
Works best for:
Org Charts, Organizational Design
The Inverted Org Chart Template is a tool that reimagines the traditional hierarchical model by placing frontline employees at the top of the organizational structure. This innovative approach highlights the crucial role played by those who interact with customers directly, ensuring that their insights and contributions are not only recognized but also celebrated. One of the key advantages of this template is that it fosters a feedback-driven environment. Prioritizing frontline workers promotes a culture where valuable insights from the ground can quickly reach the top of the hierarchy, streamlining decision-making processes and ensuring that strategies are based on real-world experiences.

20/80 Process Diagram - EOS Compatible
Works best for:
Diagramming
The 20/80 Process Diagram - EOS® Compatible template is a visual tool for mapping out processes and workflows aligned with the Entrepreneurial Operating System (EOS®) methodology. It provides a structured framework for identifying core processes and key activities that drive business outcomes. This template enables organizations to streamline operations, clarify roles and responsibilities, and enhance accountability. By promoting alignment with EOS® principles, the 20/80 Process Diagram empowers teams to achieve organizational excellence and drive sustainable growth.
Web Diagram Template
Miro's Web Diagram Template simplifies complex project organization and promotes effective communication. It allows users to easily connect elements and gain a comprehensive understanding of complex relationships, making it a versatile and invaluable asset for diverse projects.
Current State vs. Future State Flowchart Template
Works best for:
Diagramming
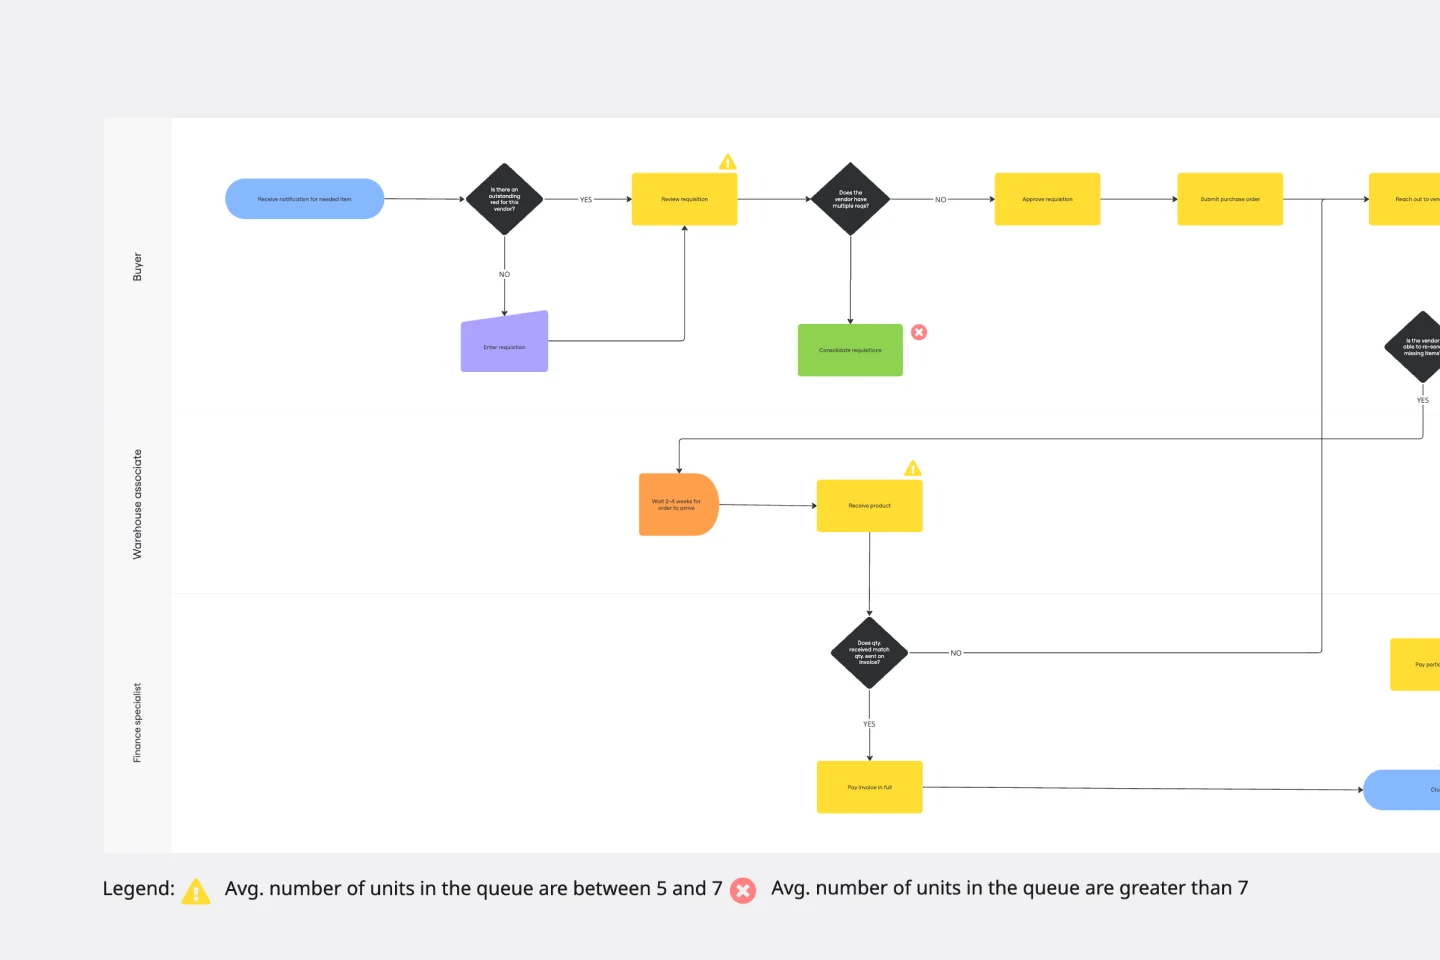
The Current State vs Future State Flowchart Template is an essential tool for strategic planning, providing teams with a dynamic and visual roadmap for organizational transformation. One of its key benefits is streamlining collaboration by using swimlanes to allocate tasks to specific departments. This feature promotes accountability and transparent communication, ensuring everyone is aligned on their responsibilities. As a result, teams can navigate complex processes with ease, fostering a shared understanding of the current and future states, ultimately leading to efficient and collaborative decision-making.