CI/CD Pipeline Diagram Template
Build a deployment pipeline and manage delivery easily with the CI/CD diagram template.
About the CI/CD Diagram Template
Efficiency and reliability are crucial in software development, and the CI/CD template helps achieve both. It is a visual guide that facilitates the integration of Continuous Integration and Continuous Delivery practices into project management. The template streamlines the development process from writing code to deploying it to production.
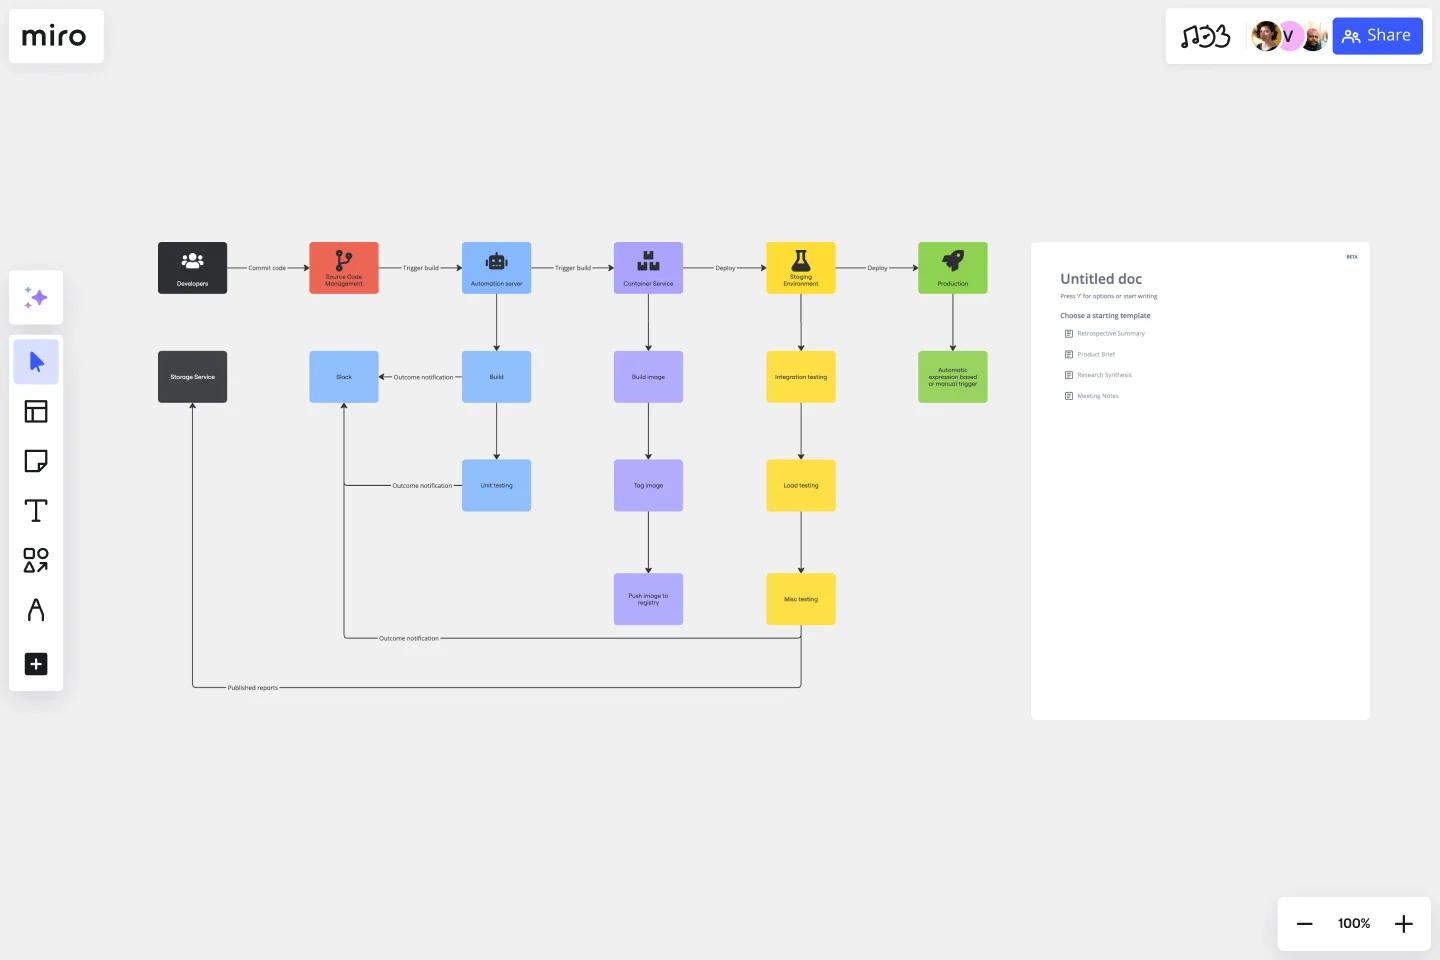
This diagram outlines each phase of the CI/CD pipeline. It provides a clear structure for the sequence of events in the automation process, including code commits, unit tests, integration tests, and deployment. Each stage has designated areas where users can plot specific actions, such as automated builds or deployment schedules. By interacting with each segment, one can trace the path from code conception to delivery, ensuring transparency and manageability at every process step.
Each area in the template not only defines a specific stage in the CI/CD process but also serves as a conduit for collaboration, allowing team members to assign tasks, share updates, and maintain the integrity and continuity of the software delivery pipeline.
Source Code Management:
Repository for maintaining code versions and history (e.g., Git repositories).
Integration with hooks/triggers to notify the CI/CD pipeline of changes.
Branching strategies and merge policies are documented here.
Access control and review process for code contributions are outlined.
Automation Server:
Central system that orchestrates the build process and executes the pipeline.
Manages task scheduling, executes automated tests, and reports outcomes.
Configurations for building jobs and dependencies between them are handled here.
Often includes a dashboard or interface for monitoring build statuses and history.
Container Server:
Infrastructure for running and managing containers (e.g., Docker, Kubernetes).
Details containerization of the application for consistent deployment environments.
Describes image repositories and management for versioning of containerized services.
Specifies orchestration requirements, scaling policies, and health checks.
Staging Environment:
A mirror of the production environment used for final testing before release.
Deployment strategies such as blue-green deployments or canary releases are outlined.
Performance testing, security scanning, and user acceptance testing criteria are specified.
Mechanisms for monitoring and logging are established for pre-production vetting.
Production:
The live environment where the application is available to end-users.
Includes details on infrastructure management, scaling, load balancing, and disaster recovery.
Security measures, compliance standards, and real-time monitoring tools are documented.
Continuous Deployment strategies for pushing changes to users with minimal downtime are detailed.
How to use the CI/CD diagram template in Miro
To harness the full potential of the CI/CD template, follow these simple steps:
Customization: Click to edit text and drag-and-drop elements to tailor the template to your project's unique pipeline structure.
Expand the Framework: Effortlessly add more shapes and connector lines using the automated diagramming features to scale the pipeline to your needs.
Integrate Artifacts: Drag any artifact onto your board to contextualize each stage—documentation, code snippets, or test results.
Why should you use a CI/CD template?
The benefits of employing a CI/CD diagram template are considerable:
Clarity in process: It provides a visual representation of the development pipeline, making complex processes understandable at a glance.
Enhanced collaboration: Teams can work together more effectively with a common visual language and understanding of the workflow.
Time efficiency: Streamlines the development process by providing a clear roadmap from development to deployment, reducing time-to-market.
Error reduction: By visualizing each step, teams can identify and address potential issues early, minimizing the risk of errors in the production environment.
Continuous improvement: A CI/CD template enables ongoing optimization of development practices by making it easy to identify bottlenecks or redundant steps.
If you prefer to start from scratch, Miro's diagramming tool is intuitive and comes with a wide range of diagramming shapes in Miro's extensive library, so you'll find just what you need.
Can the CI/CD template handle multiple project pipelines?
Absolutely. The template can be replicated or adjusted to accommodate as many project pipelines as needed.
Is the CI/CD template suitable for teams new to CI/CD practices?
Yes, it's designed to be user-friendly, making it an excellent tool for teams of any experience level to visualize and understand CI/CD workflows.
How can I track changes made to the CI/CD template?
Changes are logged, and version history can be reviewed to track the evolution of the pipeline diagram over time.
Can I integrate third-party tools into the CI/CD template?
While the template itself is a visual representation, it can be used with various third-party tools by adding links or notes to specific parts of the template, creating a dynamic and integrated project environment.
Get started with this template right now.
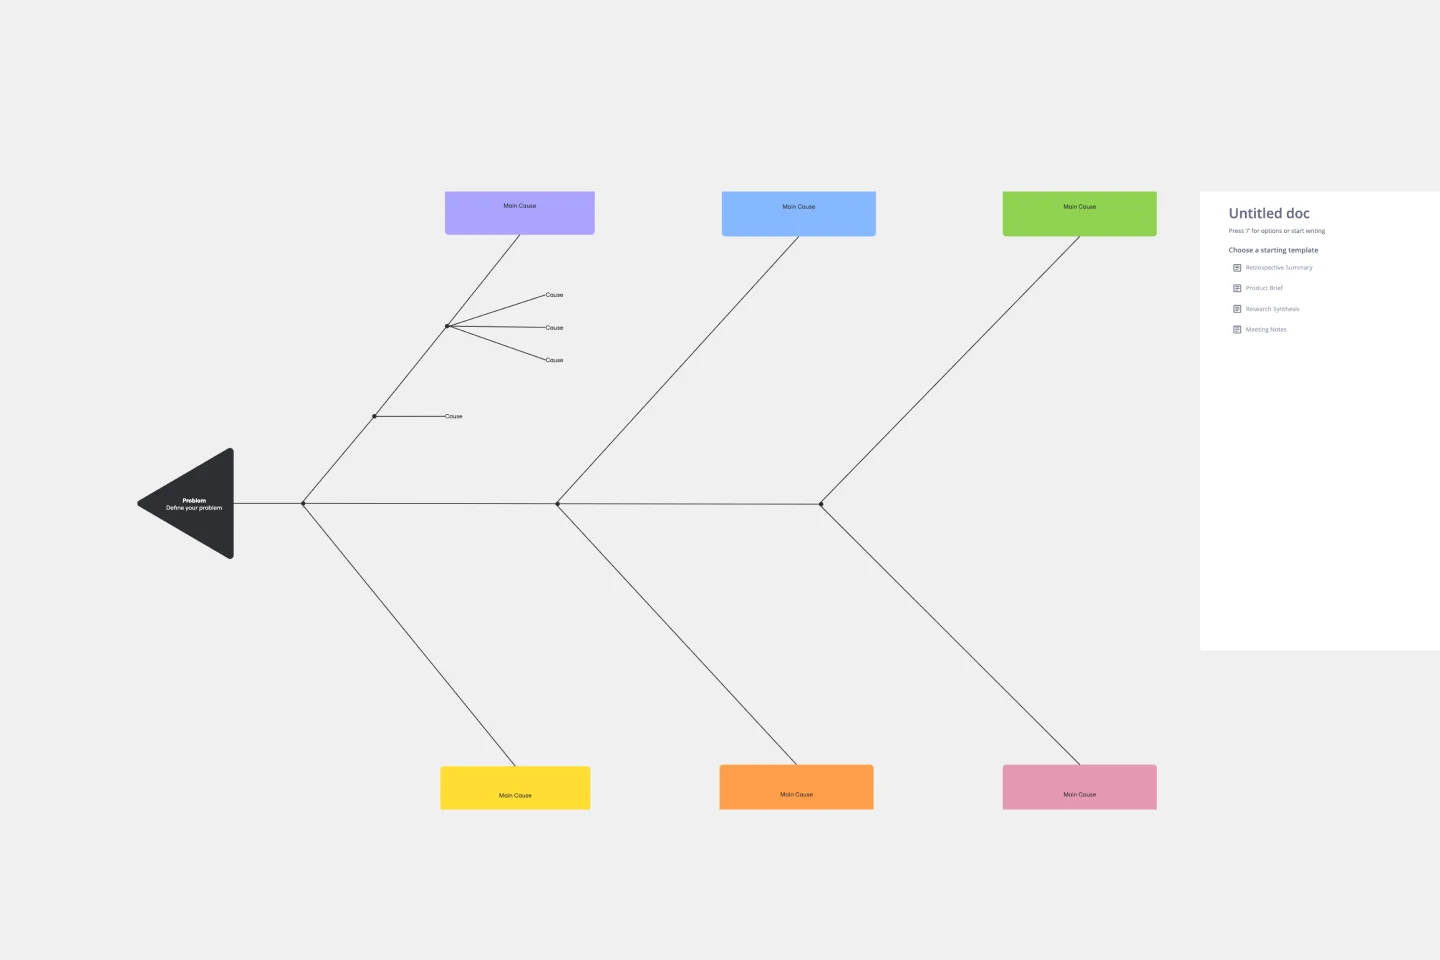
Cause and Effect Diagram Template
Works best for:
Diagramming
The Cause and Effect Diagram Template is a useful tool for analyzing complex relationships, identifying root causes of problems, and improving organizational processes. It can be customized to fit user's unique needs and provides a structured framework for analysis. Teams can use real-time collaborative analysis on the Miro platform to drive continuous improvement initiatives.
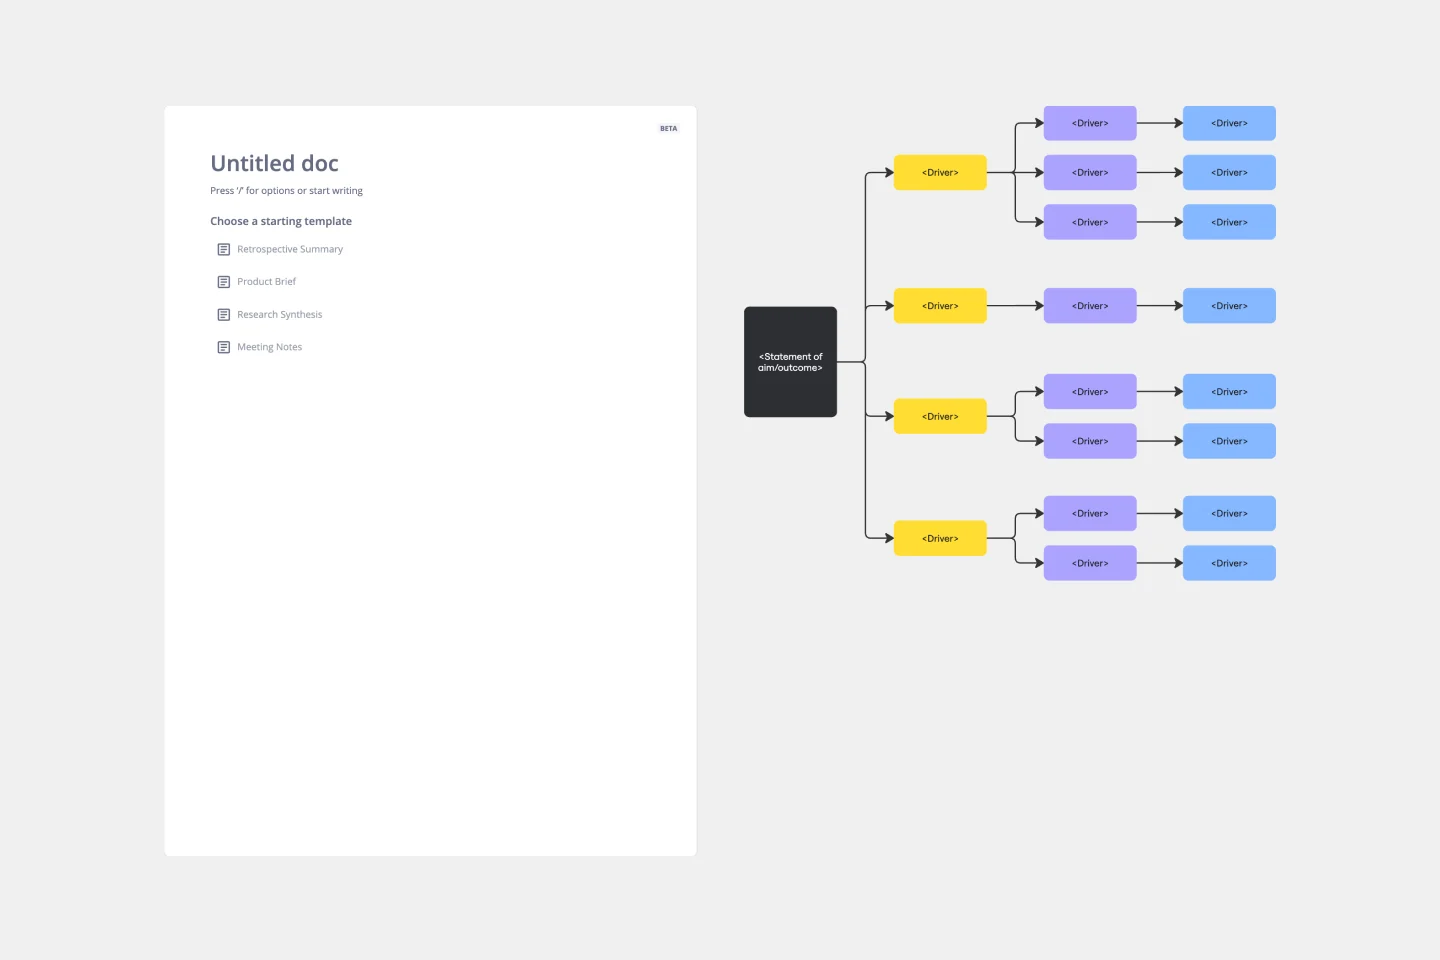
Driver Diagram Template
Works best for:
Diagramming
The driver diagram template is a strategic visual tool that helps teams map out their primary objectives and break them down into actionable components. It presents goals, drivers, and specific change ideas in a coherent and interconnected format, ensuring clarity of objective. By doing so, every team member is aligned towards a common endpoint, fostering unified efforts. The visual nature of the template simplifies complex objectives, making it easier for teams to stay on track and measure their progress effectively.
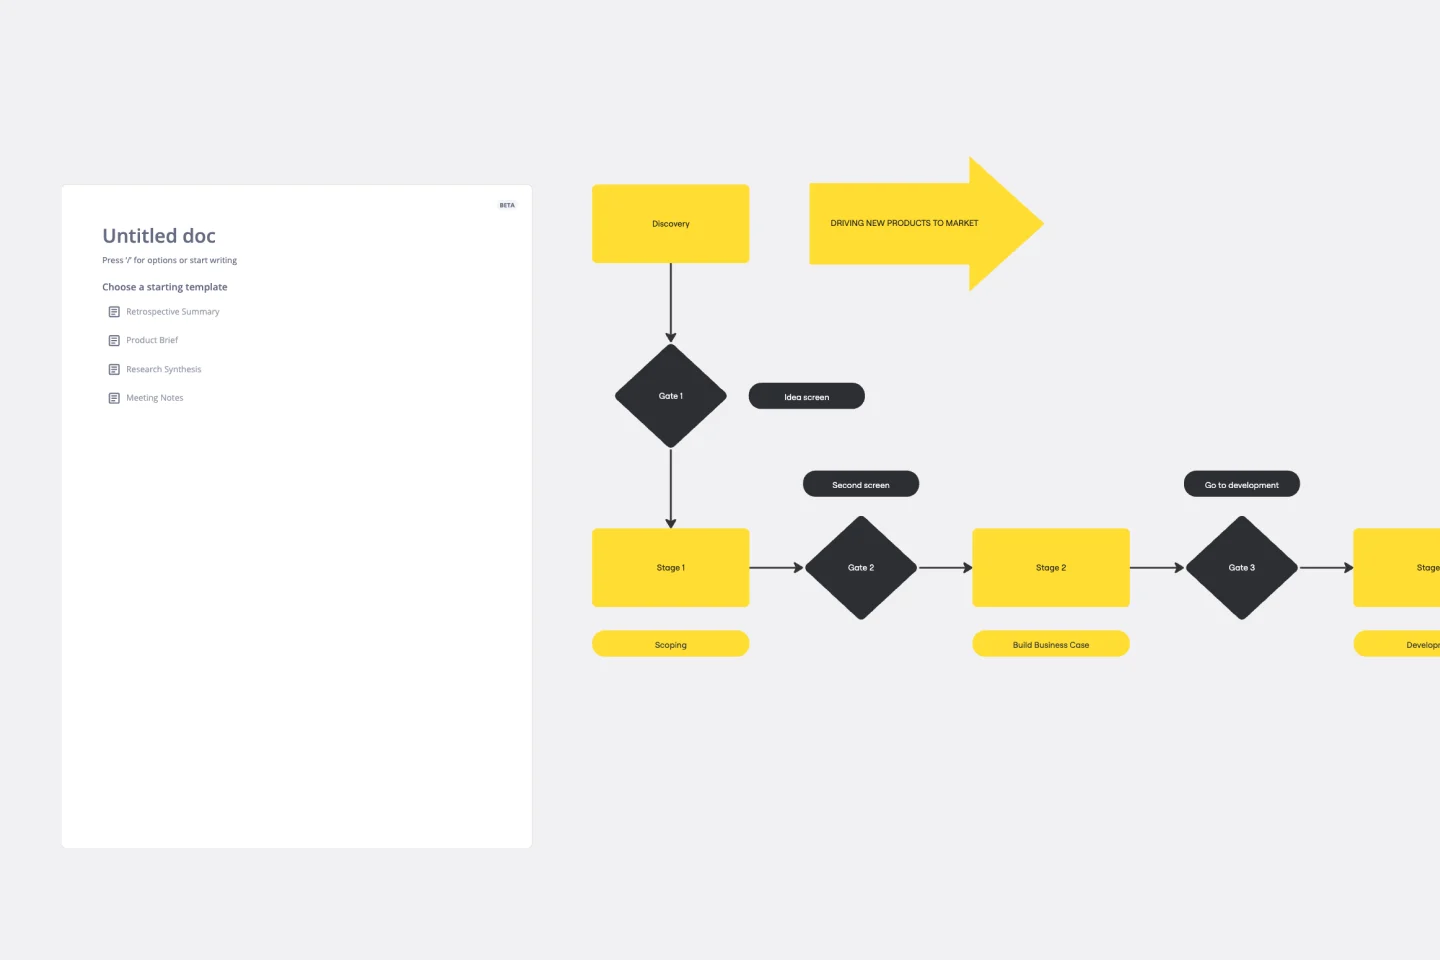
Stage-Gate Process Flowchart Template
Works best for:
Diagramming, Project Management
The Stage-Gate Process Flowchart Template structures a project into distinct stages separated by decision-making gates, enhancing the quality of decisions and leading to more successful project outcomes.
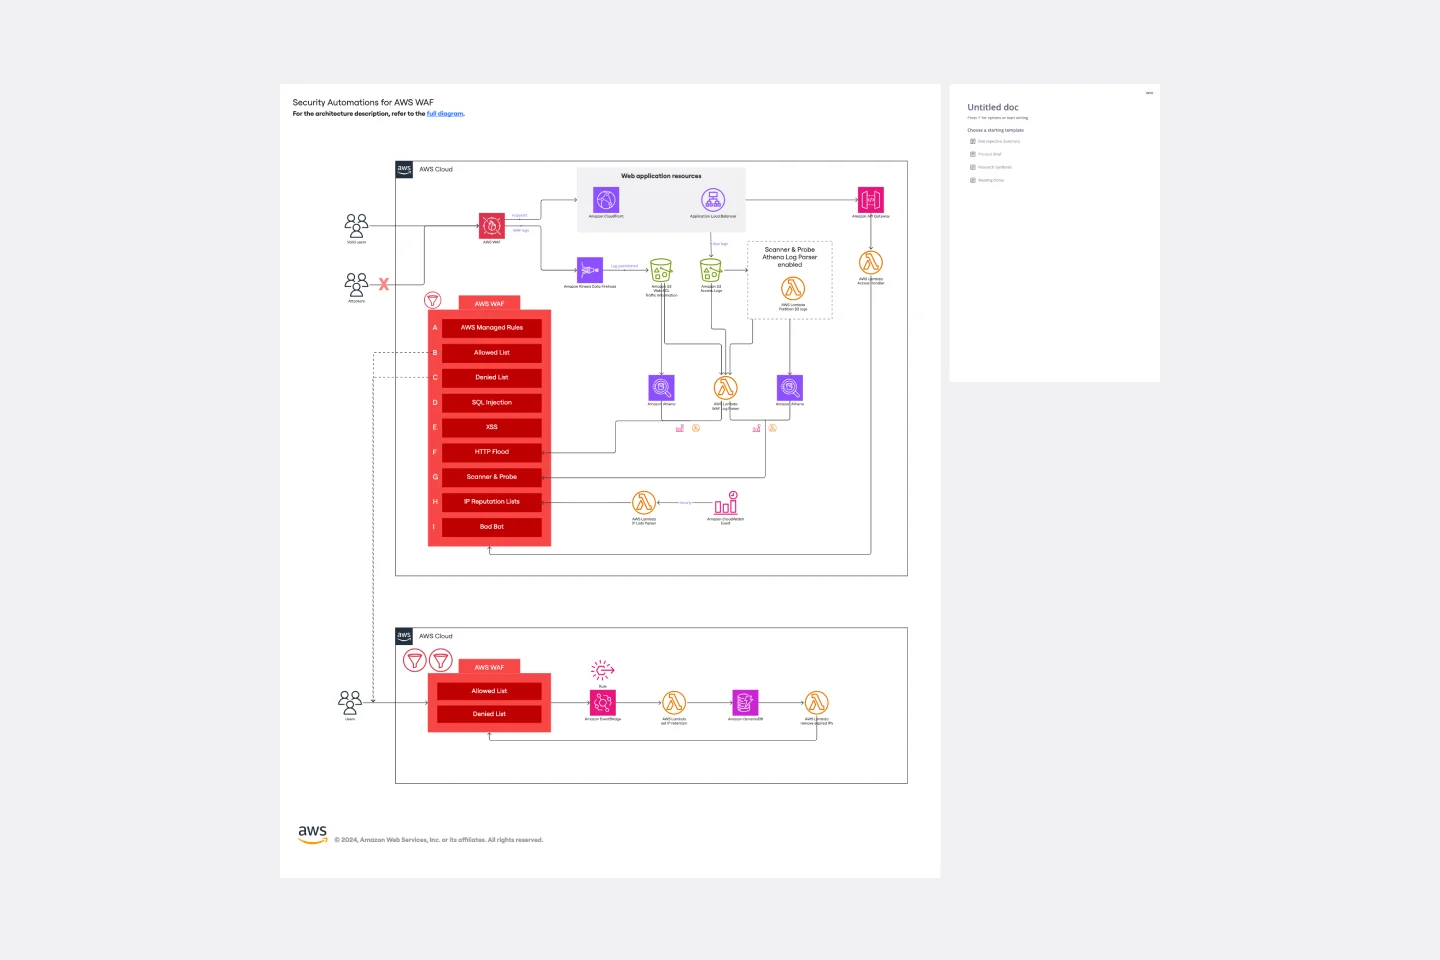
Security Automations for AWS WAF Template
The Security Automations for AWS WAF template is designed to streamline the process of enhancing the security of your AWS applications. It allows teams to collaboratively design, visualize, and refine AWS WAF configurations to protect against common web exploits effectively. This template includes various components such as automated deployment pipelines, instance schedulers, and serverless image handlers, providing a robust framework for managing AWS WAF security automations. By using this template, teams can improve collaboration, achieve a clear visual representation of their AWS WAF configurations, enhance efficiency in managing AWS WAF rules, and customize the template to meet specific application security needs.
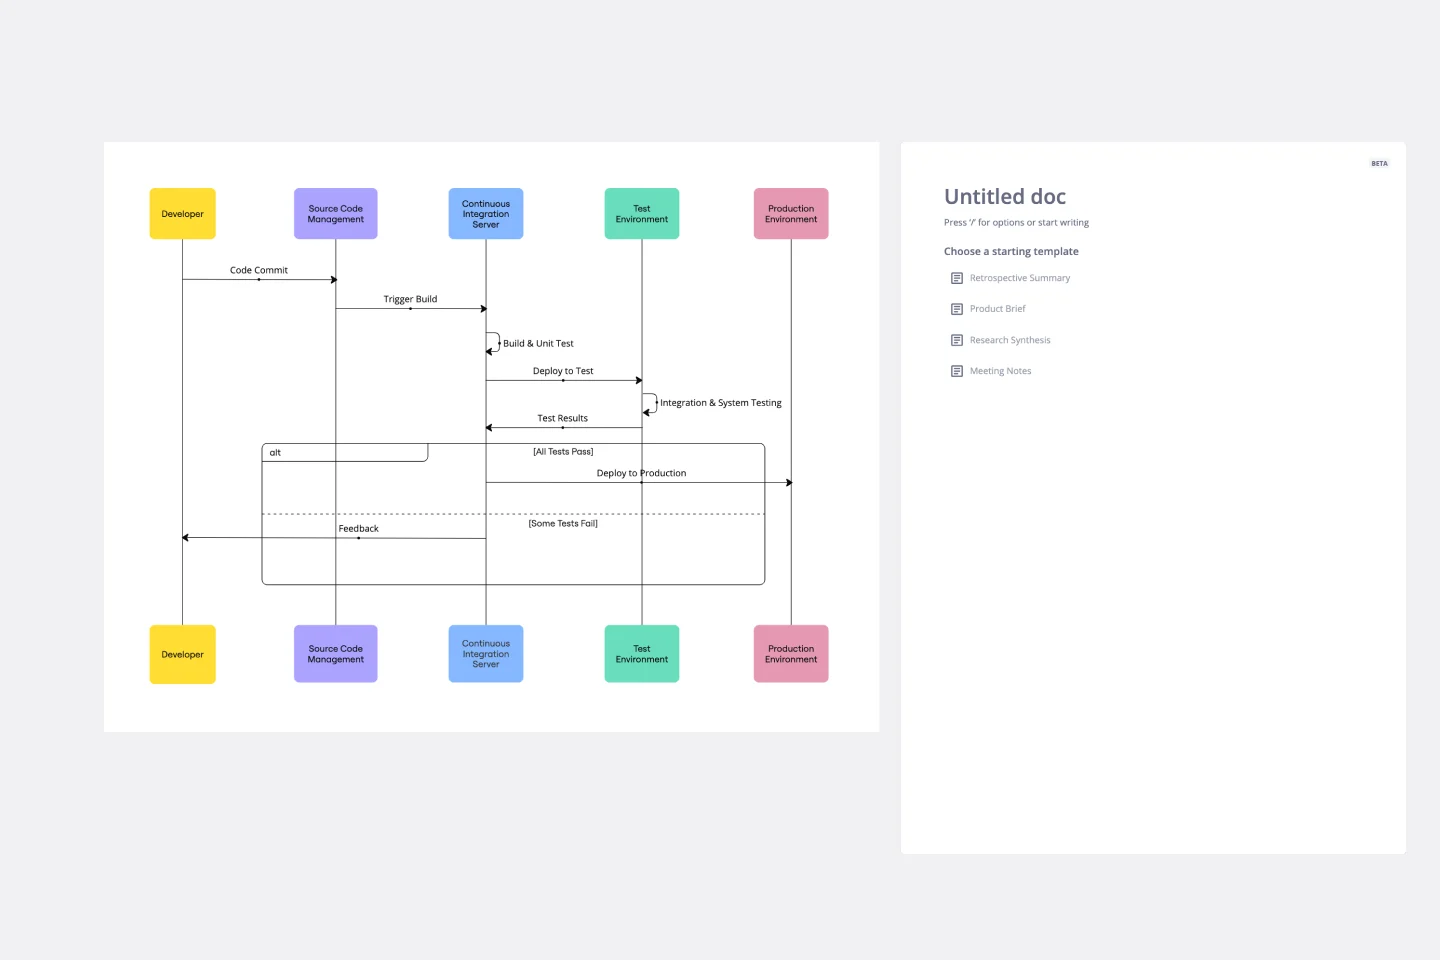
UML Sequence Deployment Pipeline Template
Works best for:
UML
The UML Sequence Deployment Pipeline Template in Miro visually maps the sequence of steps in an automated deployment pipeline, helping teams in software development and deployment. It helps identify bottlenecks, standardizes the deployment process, and facilitates new member onboarding for continuous improvement.

20/80 Process Diagram - EOS Compatible
Works best for:
Diagramming
The 20/80 Process Diagram - EOS® Compatible template is a visual tool for mapping out processes and workflows aligned with the Entrepreneurial Operating System (EOS®) methodology. It provides a structured framework for identifying core processes and key activities that drive business outcomes. This template enables organizations to streamline operations, clarify roles and responsibilities, and enhance accountability. By promoting alignment with EOS® principles, the 20/80 Process Diagram empowers teams to achieve organizational excellence and drive sustainable growth.