Data Flow Diagram Template
Model processes and map data flows efficiently with the data flow diagram template. Improve internal processes and lead development teams with more clarity.
Available on Enterprise, Business, Education plans.
About the Data Flow Diagram Template
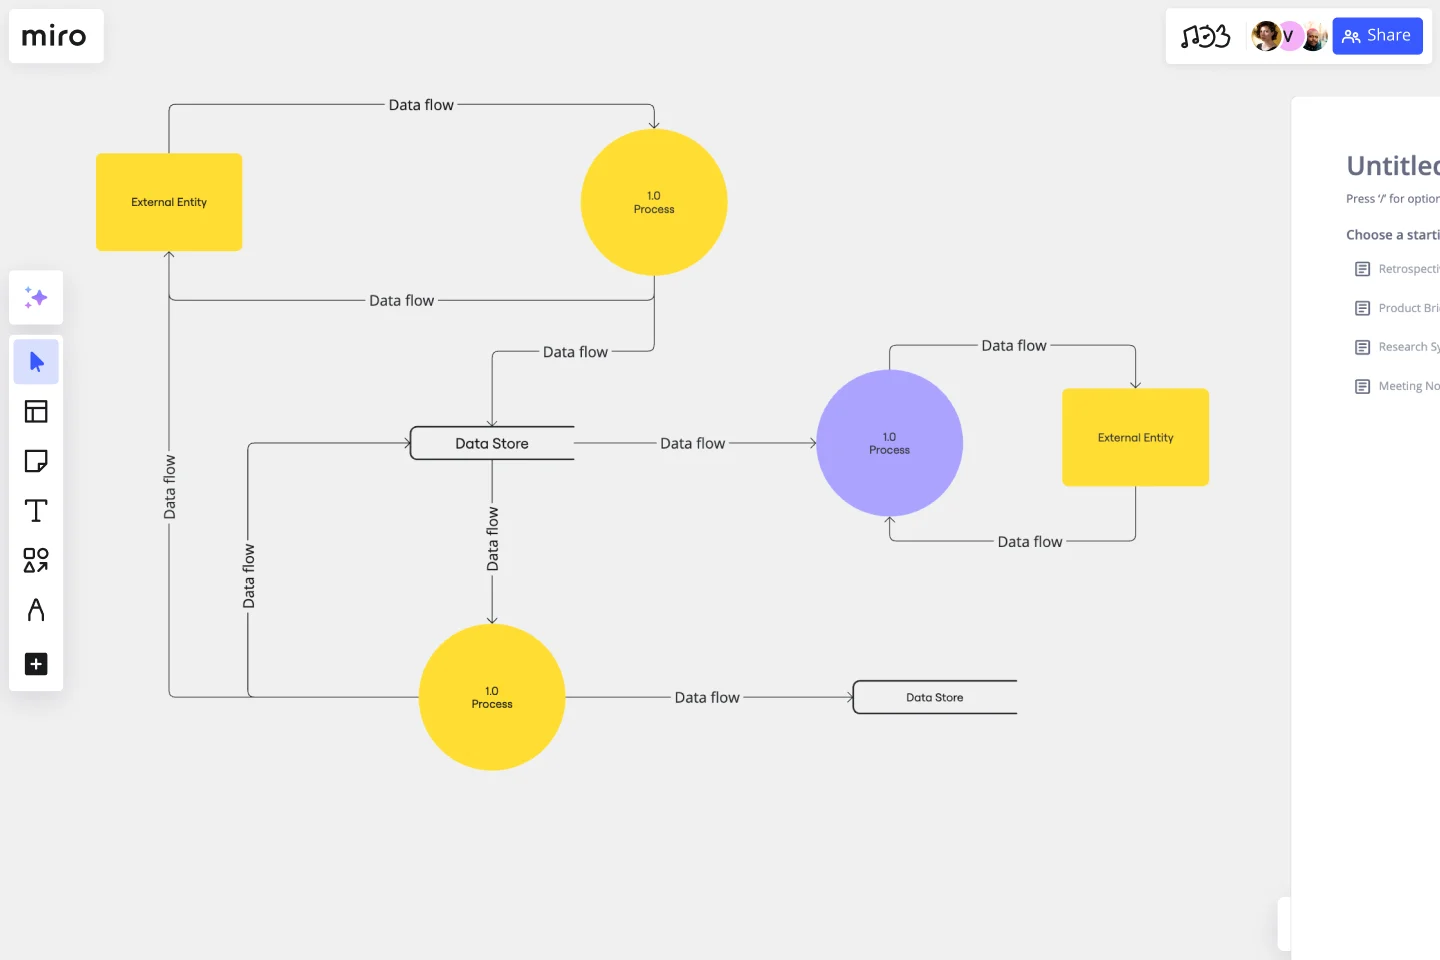
The data flow diagram template is a visual tool you can use to improve your understanding of how data travels within a system — namely by visualizing the inputs, outputs, and the processes involved. Organizations use data flow diagrams (DFD) in many business activities, including depicting notation styles, physical requirements, and system automation.
We’ll walk you through how you can start creating a data flow diagram using Miro’s free and customizable DFD template.
How to use Miro’s data flow diagram template
To get started with Miro’s data flow diagram template, scroll to the top of this page and click on the blue “use template” button. That’ll open the template and allow you to start using Miro’s diagram maker. Once you’ve opened it, think about what type of system you’re trying to visualize — whether it’s a business process, data flow within a software application, or something else. When you’re ready, here are a few more steps to make the most of the data flow diagram template.
1. Identify inputs and outputs
Each process you aim to map out should have at least one input and one output. This helps make sure that your DFD template is complete and has no loose ends. Look for the two blue, rounded rectangles on the left and right of the DFD template marked “external entity,” then edit the text boxes within them to label where the data is entering the system from and where it’ll go. To add more input and output sources, right-click on the rectangle and choose “Duplicate.”
2. Identify processes
On the data flow diagram template, the three circles labeled “Process” are for you to identify the activities or functions that manipulate data in some way. Edit the text boxes to add your system’s processes, and easily delete or duplicate these circles as needed.
3. Identify data stores
There are two symbols on the template labeled “data store.” As its name implies, it refers to where the system stores its data. Double-click on the text boxes to edit them and replace the text with how you want to label your data stores. Duplicate these symbols as needed, and click and drag them if you’d like to adjust their position on the diagram.
4. Label data flows
Last but not least, don’t forget to visualize the flow of data. The template comes with arrows connecting inputs, outputs, processes, and data stores. Edit the text along these arrows to identify the type of data that’s traveling, and click and drag them to adjust the direction of flow appropriately.
Is Miro’s data flow diagram template free?
Yes, Miro’s data flow diagram template is free and fully customizable, so you can make it your own. Just click on the blue “use template” button on this page to get started.
Who is Miro’s data flow diagram template for?
Miro’s data flow diagram template is for any team involved in system development, analysis, optimization, and collaboration — including data analysts, software development teams, growth teams, and product teams.
What’s the difference between a data flow diagram and a flowchart?
A data flow diagram is your guide to understanding the nitty-gritty of how information travels within a system — such as databases, software applications, and business processes. While a flowchart also visualizes flows, it isn’t limited to representing data. Flowcharts are versatile maps that outline processes, decisions, and actions much more broadly. Miro's free data flow diagram template is specially crafted to visualize the intricacies of data flow within complex systems.
Get started with this template right now. Available on Enterprise, Business, Education plans.
Vertical Organizational Chart
Works best for:
Organizational Charts, Organizational Design
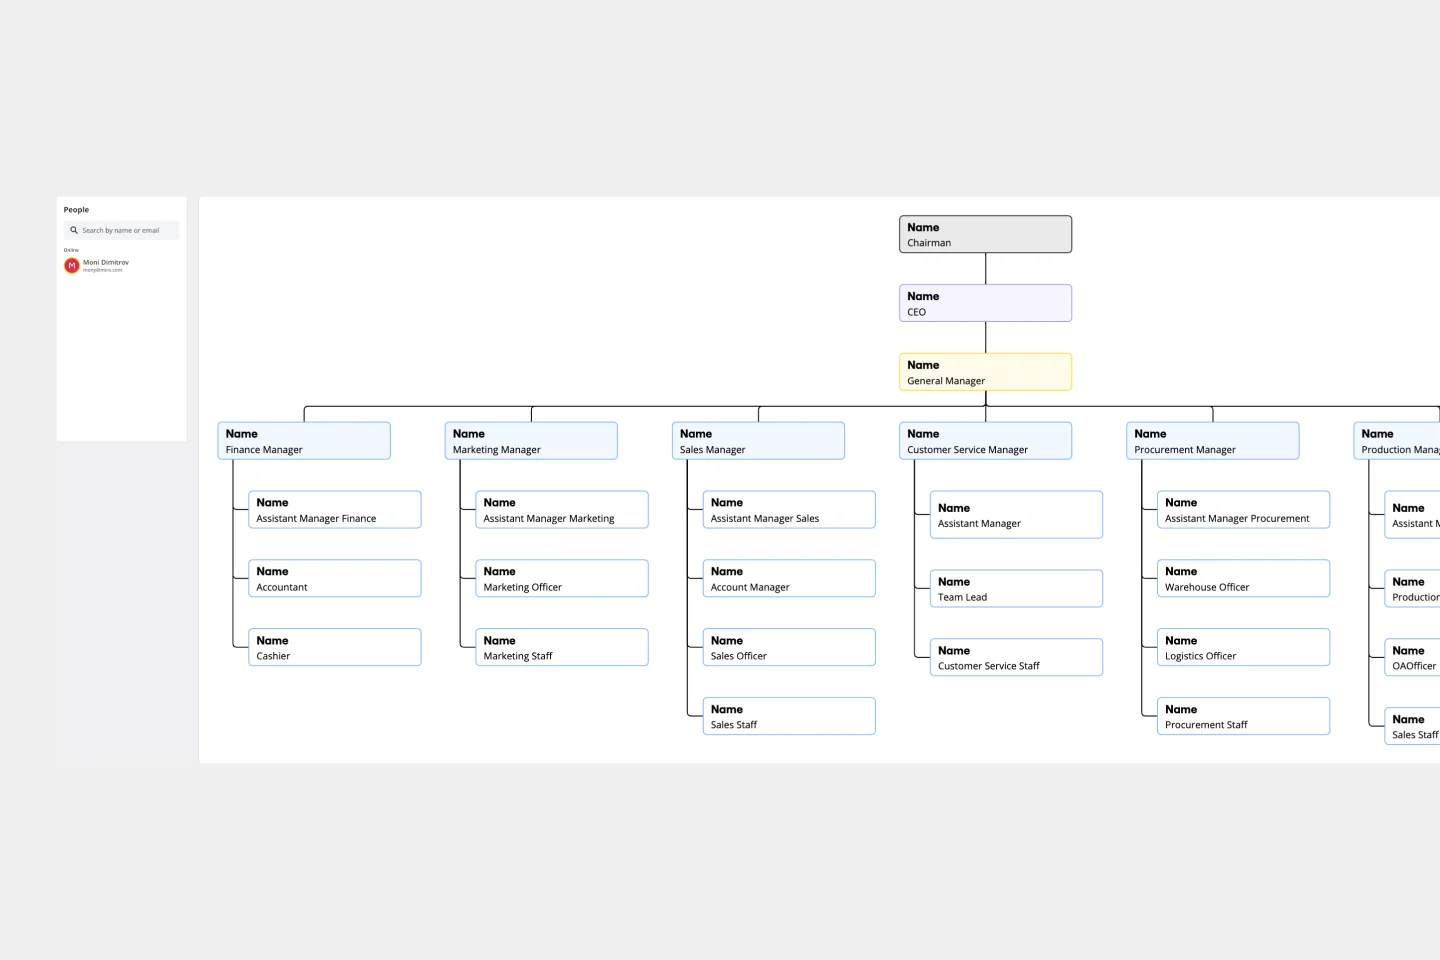
The Vertical Organizational Chart Template is an efficient way to illustrate the hierarchy of an entity in a top-down format. This tool helps represent roles and relationships in a clear manner, starting from the topmost authority and branching downwards. It allows for a better understanding of the flow of responsibilities and communication channels within the organization. One of its most significant advantages is promoting clear communication. Depicting the organization's structure helps avoid misunderstandings and ensures everyone is on the same page regarding the chain of command.
ERD Customer Relationship Management (CRM) Template
Works best for:
ERD, CRM
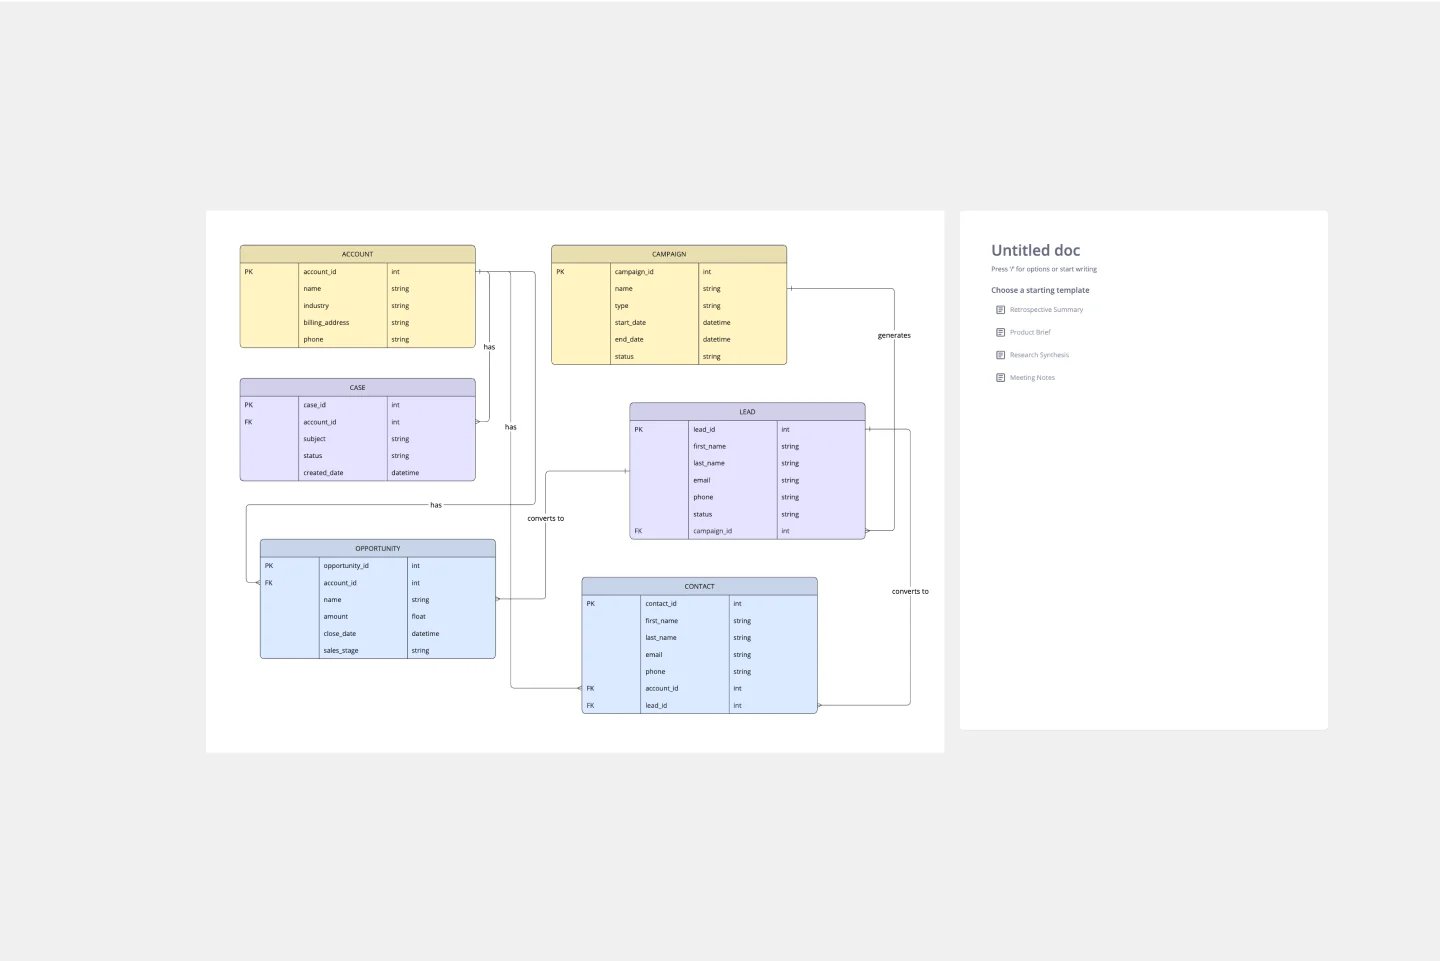
The ERD Customer Relationship Management (CRM) template streamlines and enhances the management of customer relationships within businesses. It focuses on organizing customer information and interactions in a visually intuitive manner. Key entities such as Customer, Interaction, Sales Opportunity, Product, and Support Ticket are central to the template, facilitating the tracking of customer relationships, sales funnel activities, product purchases, and customer service interactions. This structured approach is critical for boosting customer satisfaction and optimizing sales strategies, making the ERD CRM template an invaluable asset for businesses aiming to improve their CRM processes.
Azure Architecture Diagram Template
Works best for:
Software Development, Diagrams
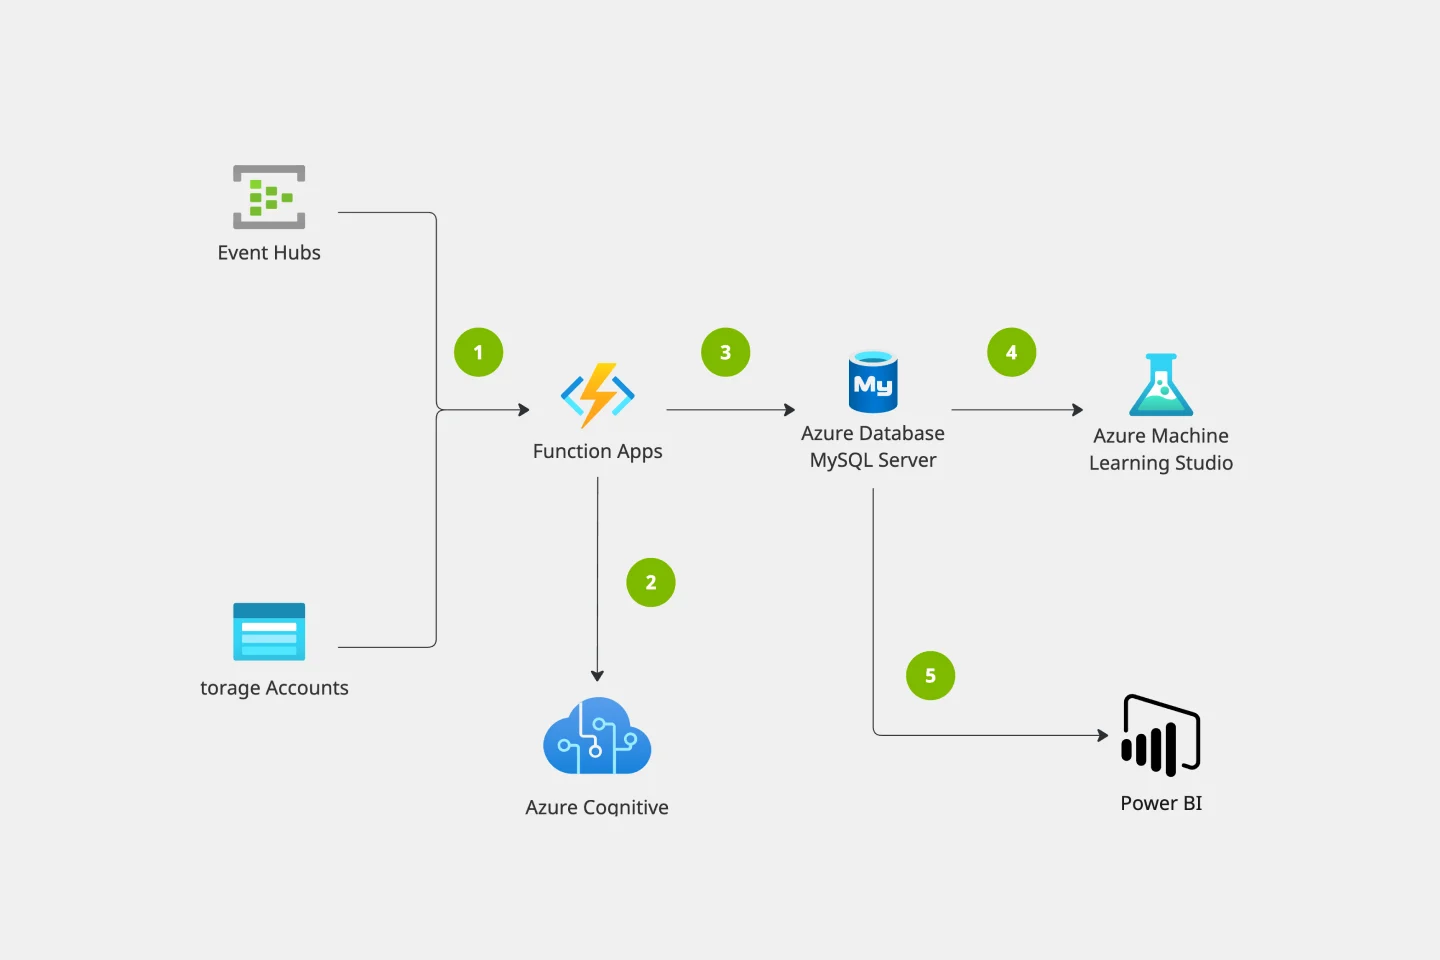
The Azure Architecture Diagram Template is a diagram that will help you visualize the combination of any data and build and deploy custom machine learning models at scale. Azure is Microsoft’s cloud computing platform, designed to provide cloud-based services such as remote storage, database hosting, and centralized account management. Use Azure Architecture Diagram template to build sophisticated, transformational apps.
Product Development Roadmap Template
Works best for:
Product Management, Software Development
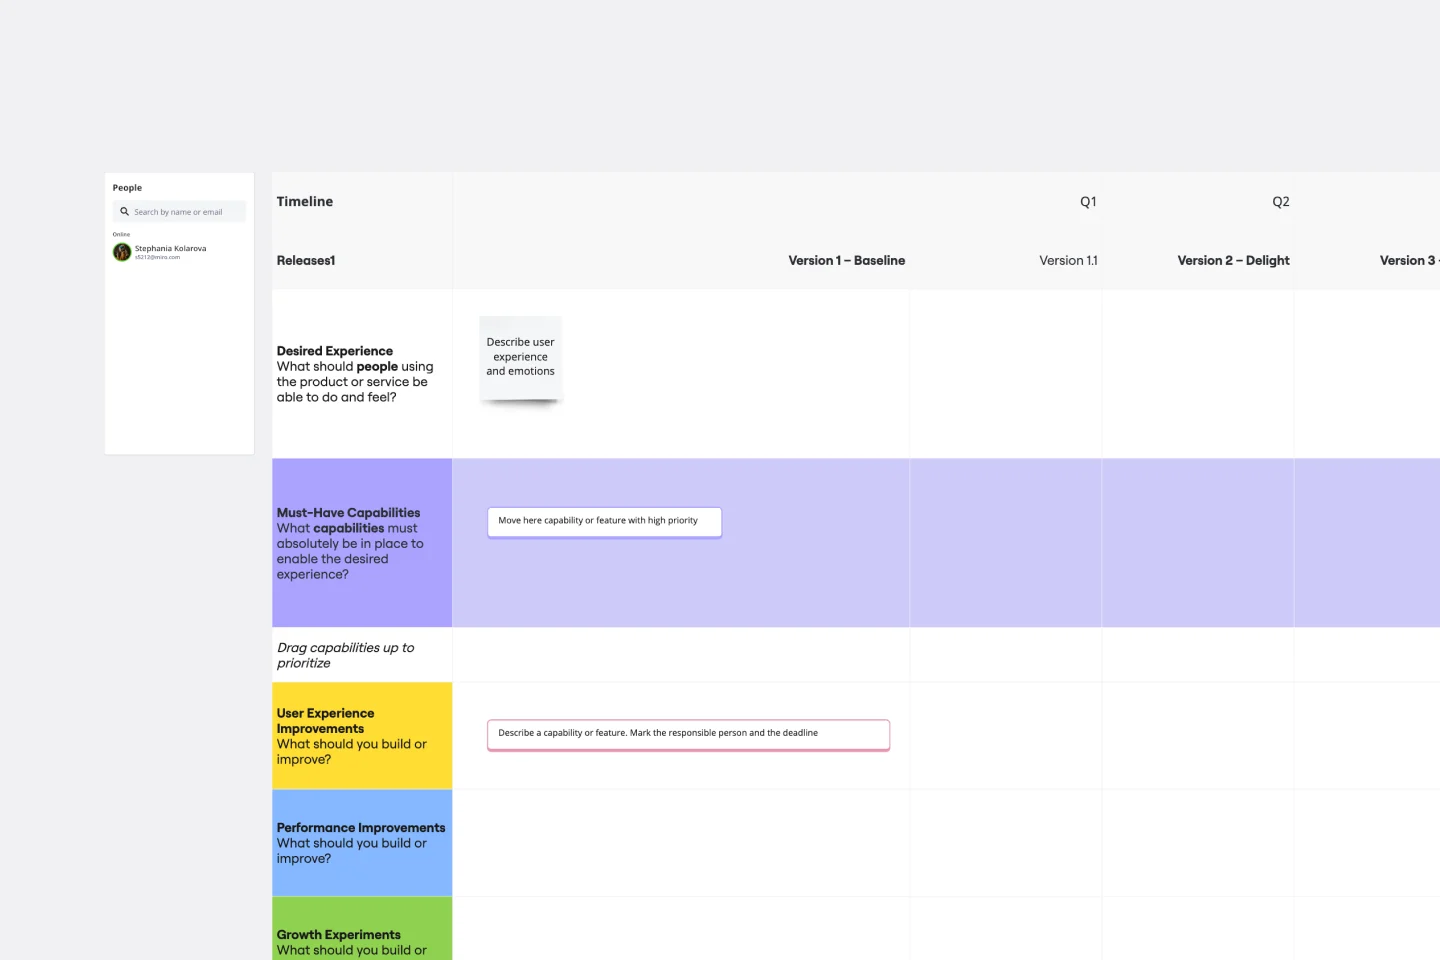
Product development roadmaps cover everything your team needs to achieve when delivering a product from concept to market launch. Your product development roadmap is also a team alignment tool that offers guidance and leadership to help your team focus on balancing product innovation and meeting your customer’s needs. Investing time in creating a roadmap focused on your product development phases helps your team communicate a vision to business leaders, designers, developers, project managers, marketers, and anyone else who influences meeting team goals.

20/80 Process Diagram - EOS Compatible
Works best for:
Diagramming
The 20/80 Process Diagram - EOS® Compatible template is a visual tool for mapping out processes and workflows aligned with the Entrepreneurial Operating System (EOS®) methodology. It provides a structured framework for identifying core processes and key activities that drive business outcomes. This template enables organizations to streamline operations, clarify roles and responsibilities, and enhance accountability. By promoting alignment with EOS® principles, the 20/80 Process Diagram empowers teams to achieve organizational excellence and drive sustainable growth.
Epic & Feature Roadmap Planning
Epic & Feature Roadmap Planning template facilitates the breakdown of large-scale initiatives into manageable features and tasks. It helps teams prioritize development efforts based on business impact and strategic objectives. By visualizing the relationship between epics and features, teams can effectively plan releases and ensure alignment with overall project goals and timelines.