Ecomap Template
Identify key support structures or potential areas of strain within an ecosystem with the ecomap template. Enable proactive decision-making and strategic interventions.
About the Ecomap Template
As more teams explore visual tools for better understanding the relationships and dynamics within a given ecosystem, the ecomap template appears as an effective solution. This template offers a fresh, intuitive way to visualize connections, giving teams an edge in crafting holistic strategies and insights.
What's an ecomap template?
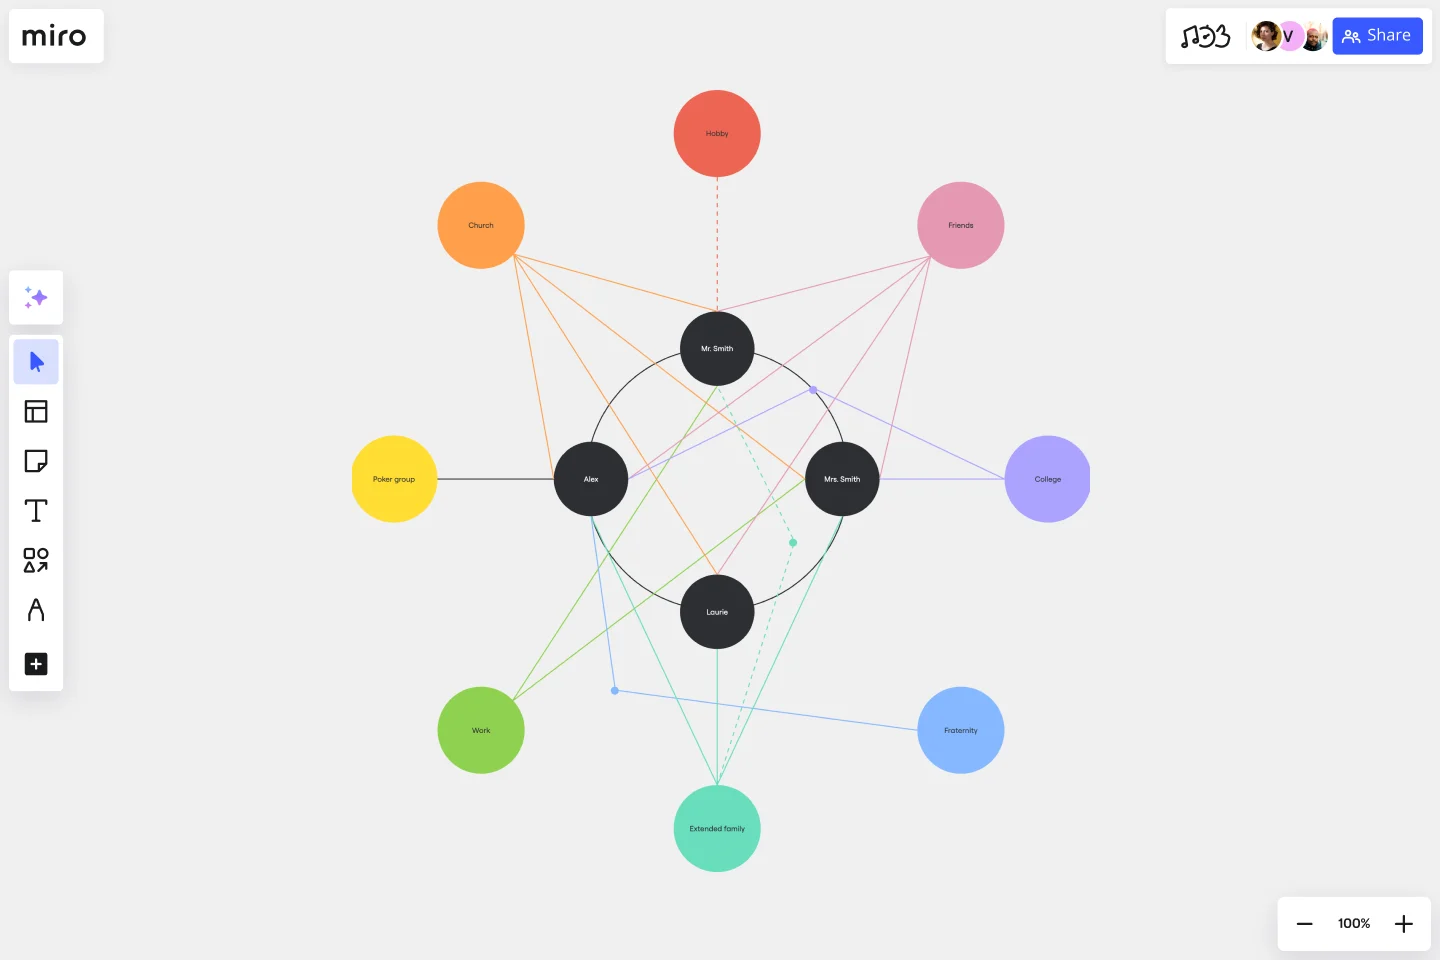
An ecomap is a visual representation that outlines the dynamic relationships between an individual or entity and their surrounding environment. The primary purpose is to understand the complex interplay of systems and relationships in which an individual or entity exists. The ecomap template is a blueprint to quickly draft these connections and discern patterns, pressures, or gaps. It serves as a unique lens, helping practitioners, teams, or researchers visualize how different systems intersect and influence one another.
The benefits of using the ecomap template
The ecomap template is more than just a drawing tool; it's a strategic instrument. By charting relationships and entities such as family members, social networks, institutions, and other relevant external factors, users can effectively discern patterns, pressures, support systems, or potential gaps in the ecosystem around the subject. The visualization offers insights into how these relationships can be nurtured, reinforced, or restructured for the central entity's well-being or strategic advantage.
Using this template, one can also monitor changes and shifts over time. Updating the ecomap can provide a clear picture of how these dynamics impact the individual or entity in focus as relationships evolve or as external factors change. Whether you're a social worker trying to understand the support structure of a client, a business trying to grasp its stakeholder relationships, or a researcher analyzing the interplay of systems, the ecomap template becomes an indispensable asset.
How to use the ecomap template in Miro
Using Miro's ecomap template is straightforward and innovative, thanks to our automated diagramming features.
Here's a step-by-step guide to creating your ecomap in a Miro board:
Select the template: Choose the ecomap template and add it to your board.
Use automated diagramming: Link and create different entities with just one click; select the shape and click on the blue dot to create or connect to another shape.
Edit your ecomap: Customize your ecomap by adding colors, adjusting line weights, and integrating icons representing different entities or relationships. This ensures clarity and adds a touch of creativity to your visualization.
Collaborate in real time: Invite team members to join and co-edit the ecomap by sharing your board link. Miro allows multiple users to interact, provide feedback, and refine the ecomap simultaneously.
Looking for more advanced diagramming features? Check out Miro's Ecomap maker for all your needs.
Can I integrate other tools with the ecomap template in Miro?
Yes, Miro offers integration options with various tools. This makes importing data or linking to other relevant resources directly within your ecomap easier.
Can I export my ecomap once completed?
Yes, Miro offers options to export your ecomap as an image or PDF, allowing for easy sharing, presentations, or documentation purposes.
Can I customize the ecomap template further than the options provided?
Yes, Miro is flexible, allowing you to tweak and adjust templates to fit your needs. You can add elements, and design features, or even combine them with other templates.
Get started with this template right now.
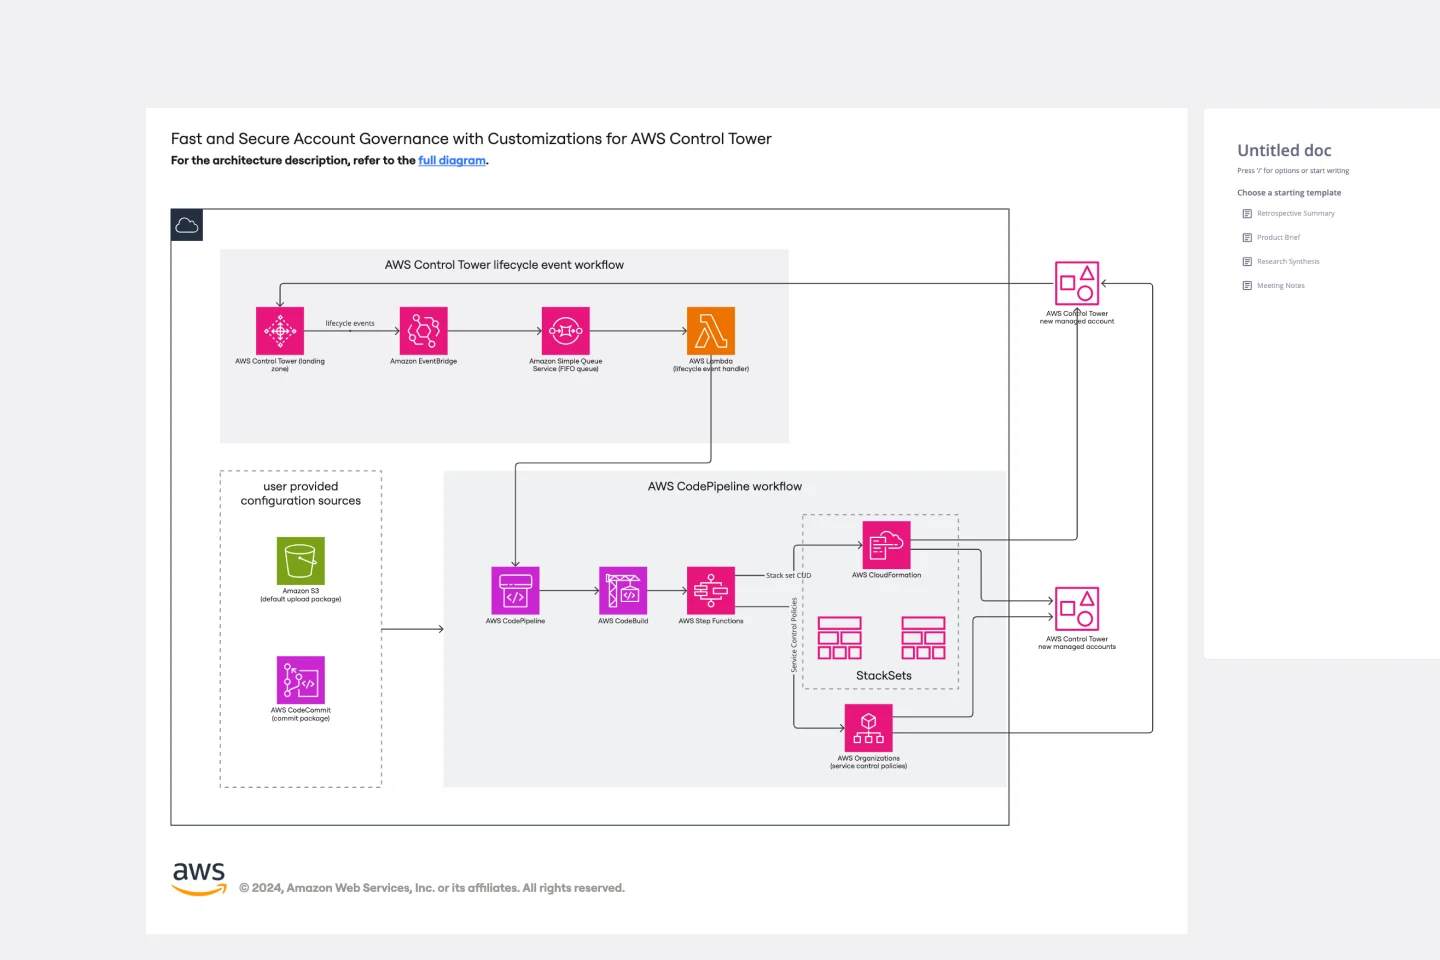
AWS Control Tower Account Governance Template
Works best for:
AWS
The AWS Control Tower Account Governance Template streamlines the setup and management of governance across multiple AWS accounts. It leverages AWS Control Tower to automate and simplify the governance process, ensuring that your AWS environment adheres to best practices for security, operations, and compliance. This template is highly customizable, allowing you to adjust governance controls and policies to meet the unique requirements of your organization. It provides a centralized view of your AWS environment, enhancing visibility and control, and scales with your organization as it grows.
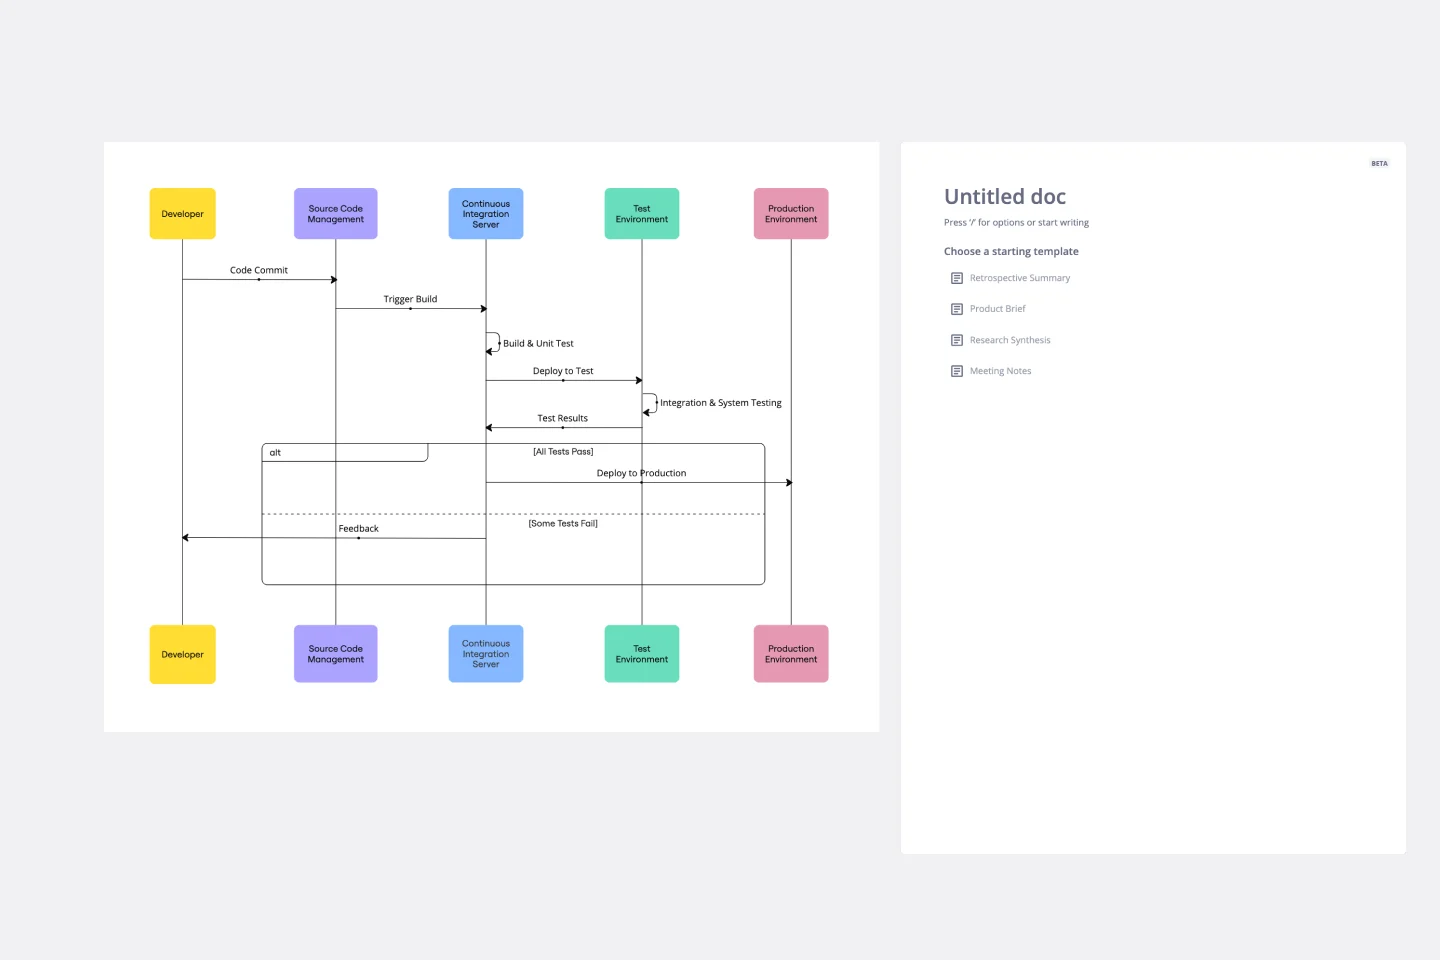
UML Sequence Deployment Pipeline Template
Works best for:
UML
The UML Sequence Deployment Pipeline Template in Miro visually maps the sequence of steps in an automated deployment pipeline, helping teams in software development and deployment. It helps identify bottlenecks, standardizes the deployment process, and facilitates new member onboarding for continuous improvement.
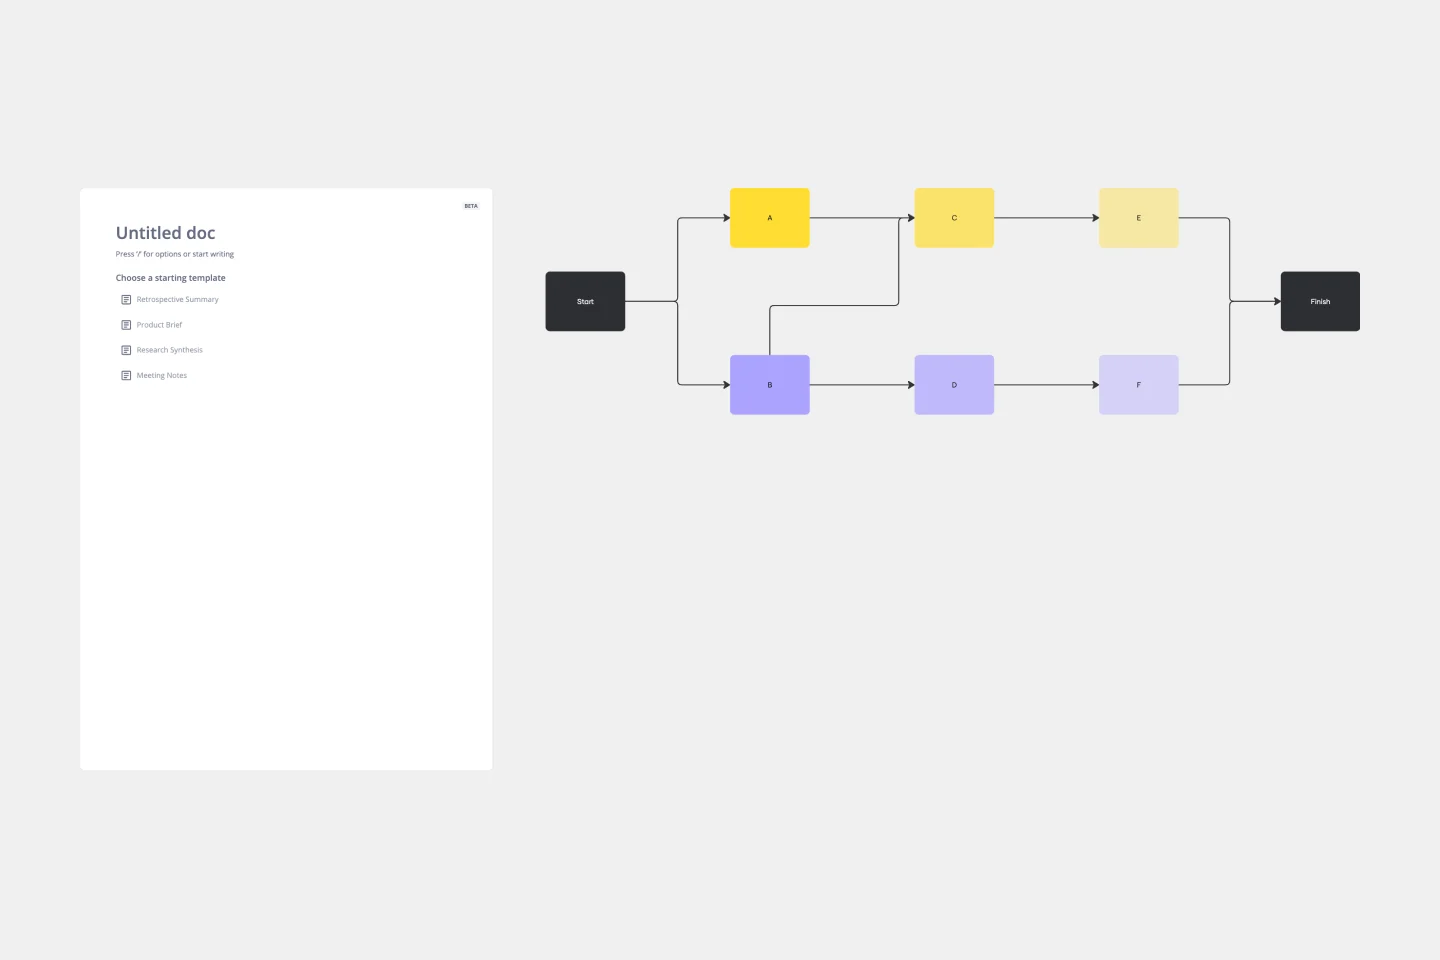
Precedence Diagram
Works best for:
Diagramming, Mapping
The Precedence Diagram Template offers a visual tool that maps out project activities and their interrelated sequences. This diagram empowers teams to recognize and anticipate workflow structures by illustrating the connections and dependencies among tasks.
Timeline-Retrospective
Works best for:
Timeline, Planning
Use the Timeline Retrospective template to review project progress and outcomes. It’s ideal for identifying what worked well and what didn’t, facilitating continuous improvement. This template helps teams reflect on their performance and make informed decisions for future projects.

BPM
Works best for:
Diagramming
The BPM (Business Process Management) template is a visual tool for modeling, analyzing, and optimizing business processes. It provides a structured framework for documenting process flows, identifying bottlenecks, and improving efficiency. This template enables organizations to streamline operations, enhance productivity, and drive business performance. By promoting process transparency and agility, the BPM template empowers teams to achieve operational excellence and deliver value to stakeholders.

20/80 Process Diagram - EOS Compatible
Works best for:
Diagramming
The 20/80 Process Diagram - EOS® Compatible template is a visual tool for mapping out processes and workflows aligned with the Entrepreneurial Operating System (EOS®) methodology. It provides a structured framework for identifying core processes and key activities that drive business outcomes. This template enables organizations to streamline operations, clarify roles and responsibilities, and enhance accountability. By promoting alignment with EOS® principles, the 20/80 Process Diagram empowers teams to achieve organizational excellence and drive sustainable growth.