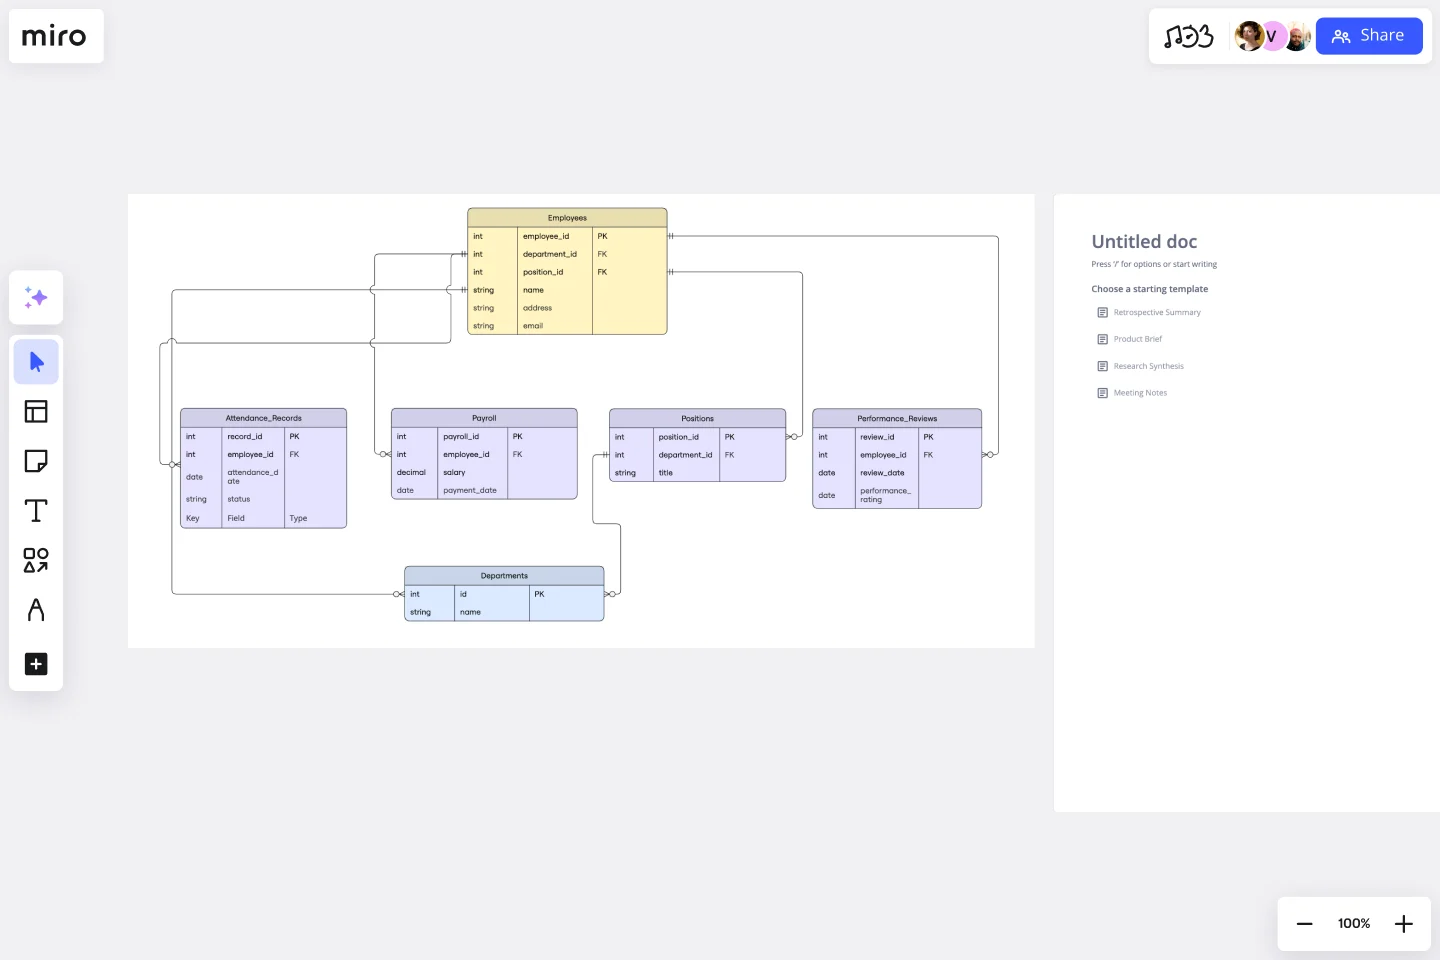
Entity–Relationship Diagram (ERD) HR Management System Template
Use the Entity Relationship Diagram (ERD) HR Management System template to provide a clear and comprehensive visualization of complex HR systems, optimize HR operations, and facilitate strategic planning and decision-making within your organization.
Available on Enterprise, Business, Education plans.
About the Entity–Relationship Diagram (ERD) HR Management System Template
The Entity–Relationship Diagram (ERD) HR Management System template is a tool designed to streamline the organization's visualization and management of employee-related information and processes. This template allows users to create a detailed map of how employees are interconnected within various departments, their positions, attendance records, payroll details, and performance reviews. By providing a clear overview of these relationships, the ERD HR Management System template aids in optimizing HR operations, enhancing human resources management, and facilitating strategic planning and decision-making.
How to use the Entity–Relationship Diagram (ERD) HR Management System Template
Customize your diagram: Once the template is open in Miro, you can start customizing it to fit your organization's specific needs. Add entities such as departments, positions, and employees. You can also define the relationships between these entities, such as which department an employee belongs to or what position they hold.
Add attributes: For each entity, you can add attributes like employee ID, name, role, salary, and performance metrics. This will enrich your diagram and provide a more comprehensive view of your HR system.
Collaborate and share: Invite team members to collaborate on the diagram in real time. Miro's collaborative features allow you to discuss, edit, and refine the ERD together, ensuring that all stakeholders have input into the HR management system's design.
Export and present: Once your ERD is complete, you can easily export it to various formats or present it directly within Miro to stakeholders. This facilitates communication and alignment across the organization.
Why use the Entity–Relationship Diagram (ERD) HR Management System Template
Using the ERD HR Management System template in Miro offers several benefits:
Clarity and insight: It provides a clear visual representation of complex HR systems, making it easier to understand relationships and processes.
Efficiency: Streamlines the process of documenting and managing HR-related information, saving time and reducing errors.
Collaboration: Enhances teamwork by allowing multiple users to work on the diagram simultaneously, share insights, and make decisions together.
Flexibility and customization: The template is highly customizable, allowing you to tailor it to the specific needs of your organization. Whether you're a small startup or a large enterprise, you can adjust the ERD to reflect the unique structure and processes of your HR system.
Strategic Planning: With a comprehensive view of the HR management system, organizations can better plan for future needs, identify areas for improvement, and make informed decisions about resource allocation and organizational development.
Compliance and Security: The template can help ensure that your HR system complies with relevant laws and regulations by clearly mapping out data flows and access controls. This is crucial for protecting sensitive employee information and avoiding legal issues.
The Entity-Relationship Diagram (HR) Management System template in Miro is an essential tool for any organization seeking to streamline its HR operations. Its clarity, efficiency, collaborative features, flexibility, and strategic planning capabilities make it indispensable for HR professionals and organizational leaders. By using this template, you can establish a well-organized, compliant, and effective HR management system that aligns with your organization's goals and needs.
Get started with this template right now. Available on Enterprise, Business, Education plans.
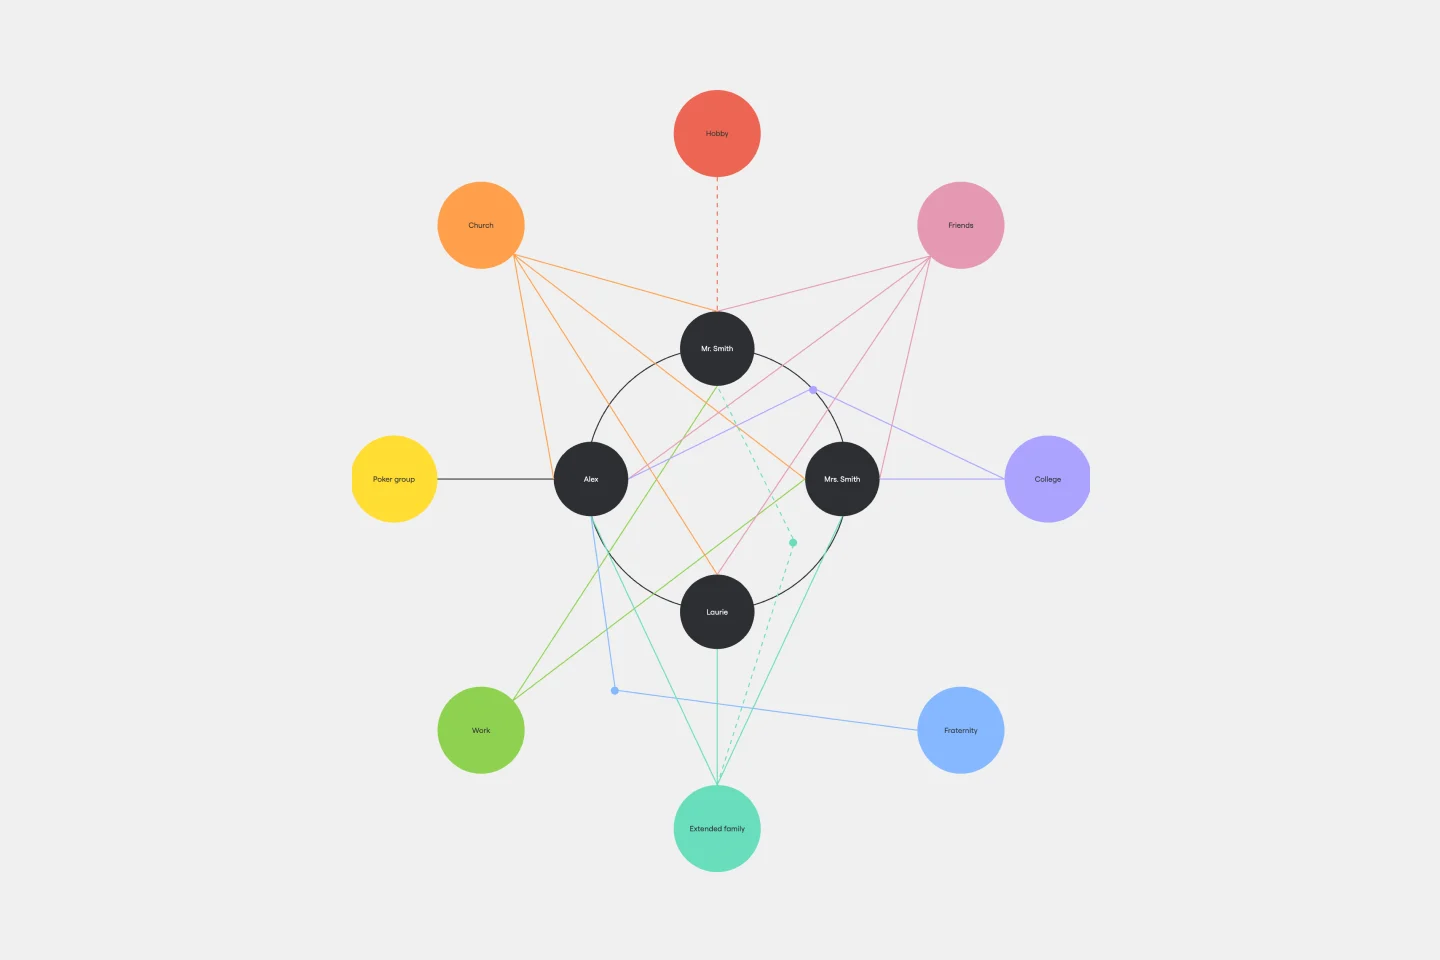
Ecomap Template
Works best for:
Strategy & Planning, Diagramming
The Ecomap Template illustrates the multifaceted relationships and environmental interactions encircling an individual or entity. Determine crucial patterns and dynamics by providing a clear and comprehensive visualization of how different systems intertwine and influence each other.
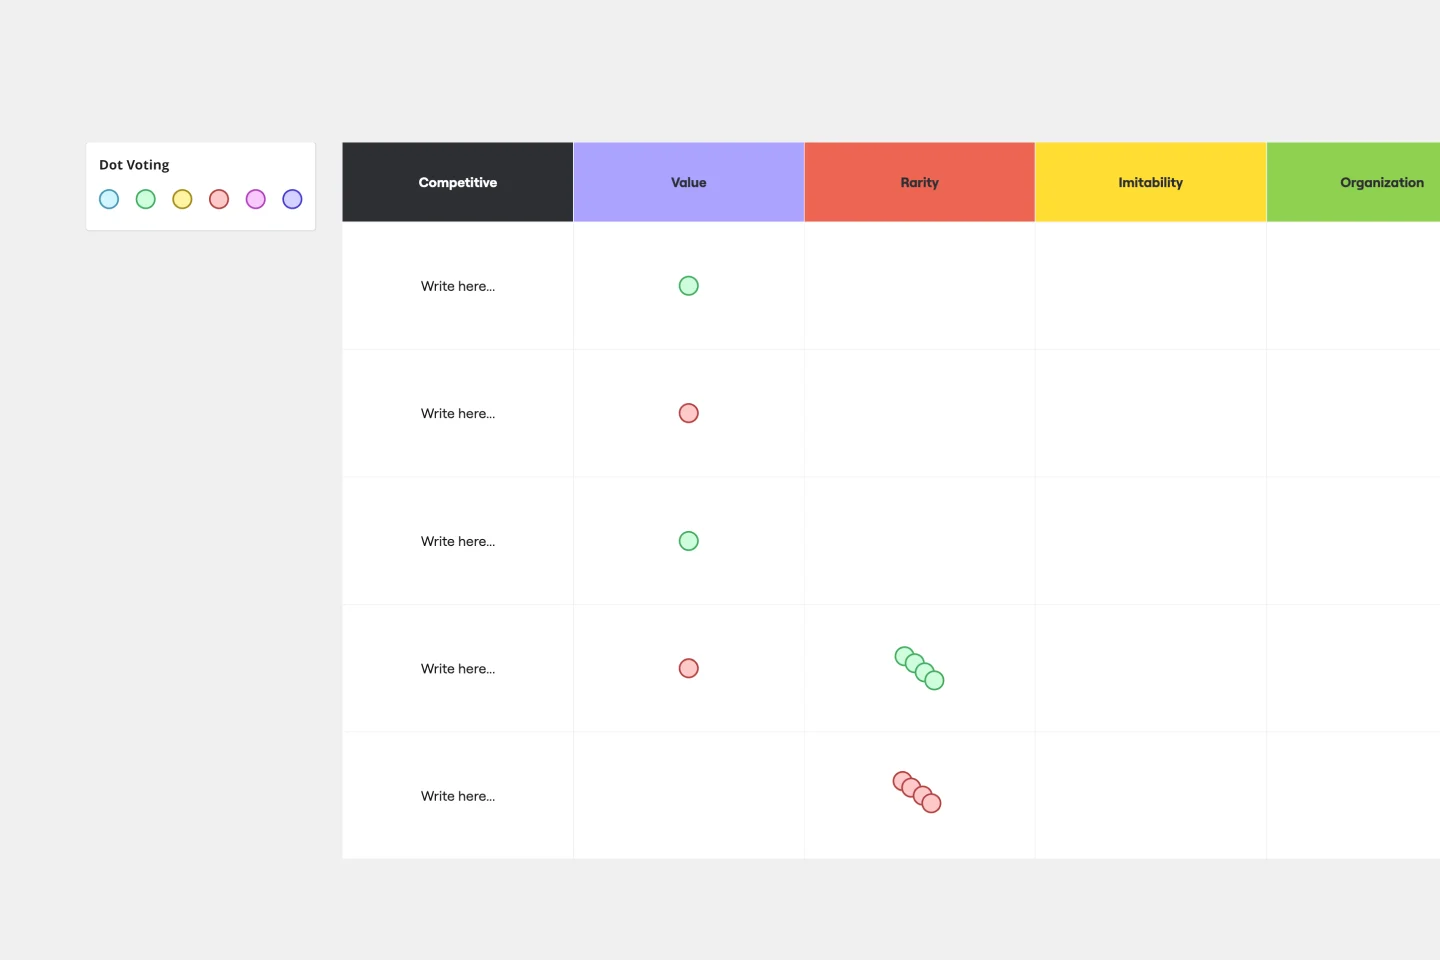
VRIO Analysis Template
Works best for:
Diagramming, Strategy
The VRIO Analysis Template is a framework that helps businesses evaluate their resources and capabilities for competitive advantage. It categorizes resources into four areas: Value, Rarity, Imitability, and Organization. This provides a comprehensive view of an organization's strengths and potential weaknesses. The template has the key benefit of offering quick visual insights. Decision-makers can immediately identify and focus on resources that are valuable, rare, hard to imitate, and well-organized. This ensures a sustainable competitive edge and saves time by avoiding lengthy textual analyses.
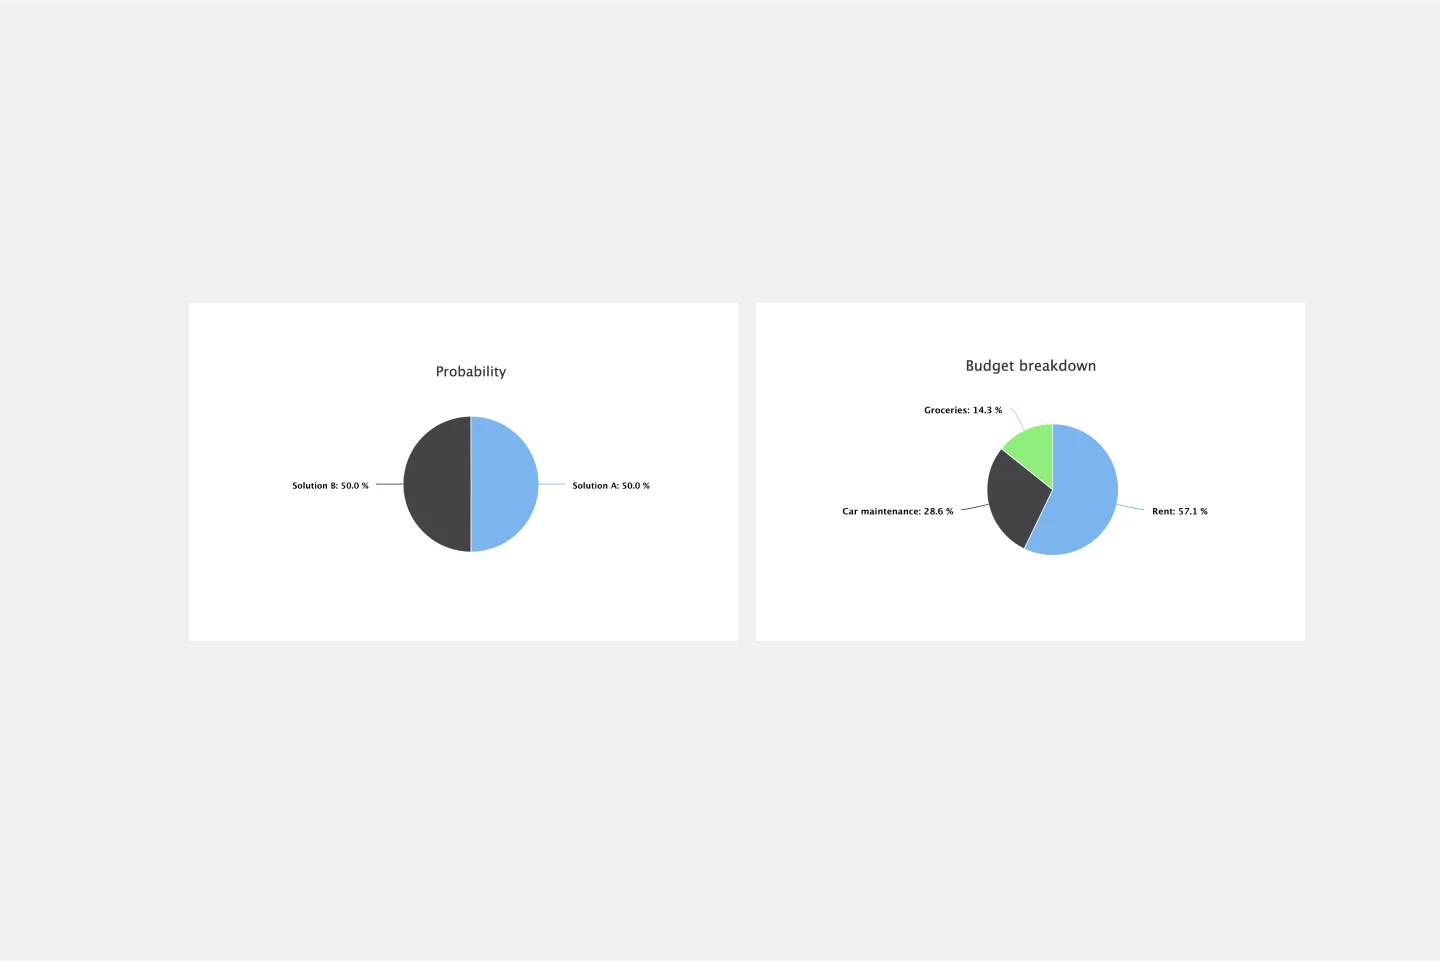
Pie Chart Template
Works best for:
Education, Operations
Pie charts are an excellent way to present relationships between datasets graphically, where you can quickly compare information and see contrast right away. Professionals from many fields use pie charts to support their presentations and enrich their storytelling as it’s one of the most commonly used data charts.
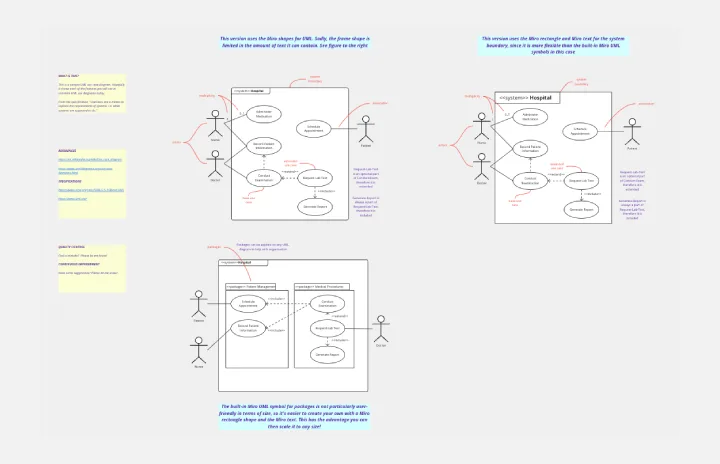
UML Use Case Diagram
Works best for:
UML Diagrams, Diagramming
Visualize system interactions with the UML Use Case Diagram. This template helps you map out user interactions and system processes, providing a clear overview of functional requirements. Ideal for software developers, business analysts, and project managers, it supports planning and communicating system functionalities. Use it to ensure all user scenarios are considered and to facilitate better design and implementation of software systems.
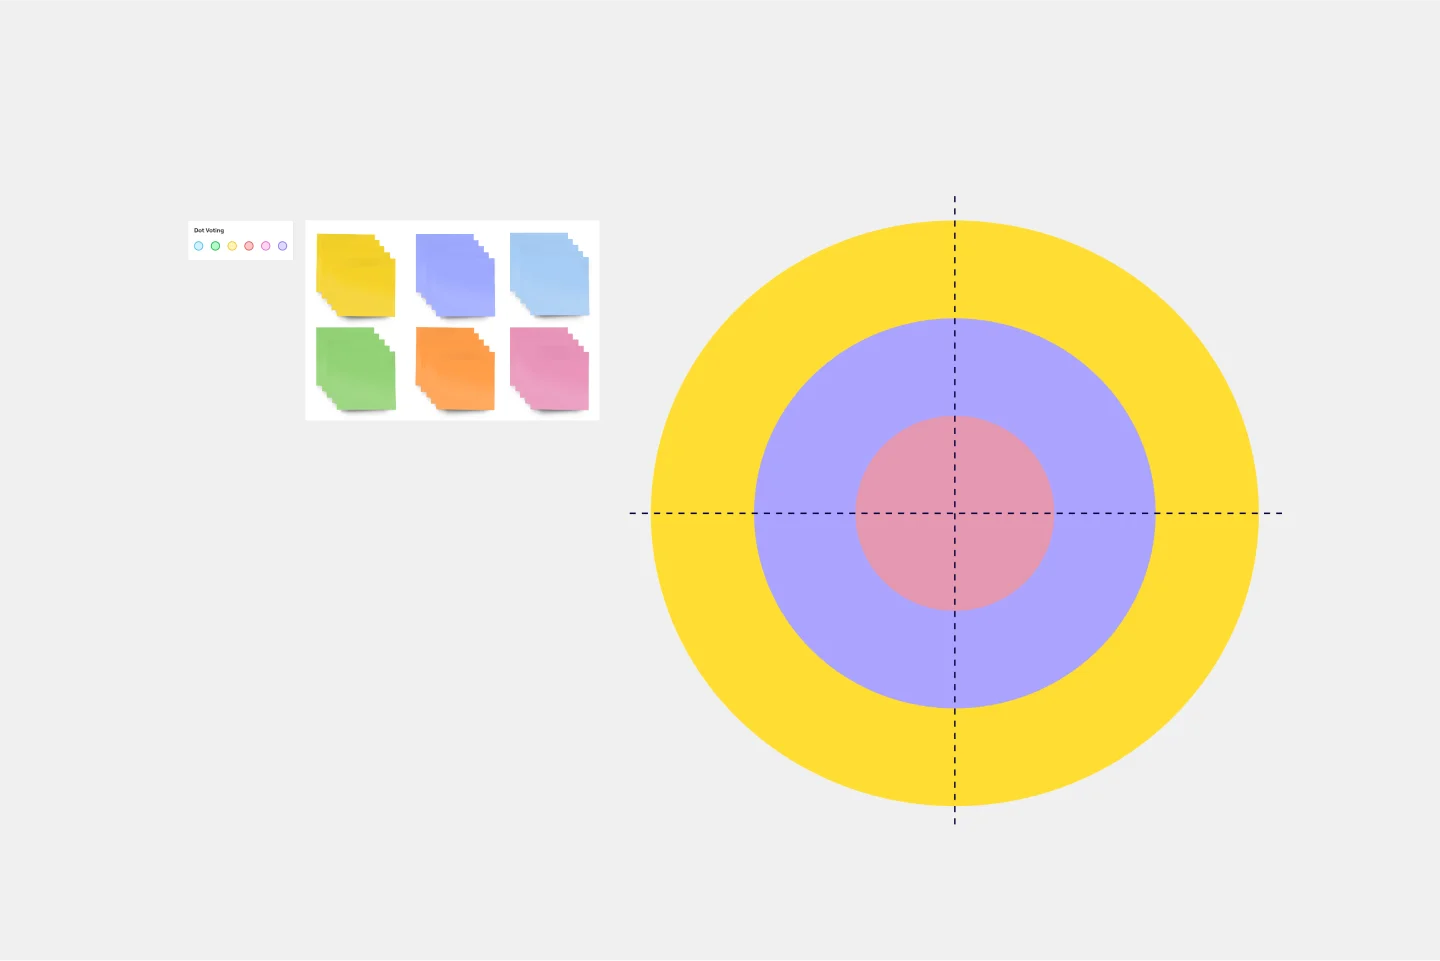
What's on Your Radar Template
Works best for:
Business Management, Operations, Strategic Planning
Do you or your team feel overburdened by tasks? Having trouble focusing on particular problems? What’s on Your Radar is a thought exercise in which you plot ideas according to their importance or relevance. Designers and teams use what’s on your radar to ensure that their ideas are within the scope of a given project. They also rely on the method to assess whether a given solution is likely to solve the problem at hand. But even if you’re not a designer, the method can help assign priorities and ground your ideas in reality.
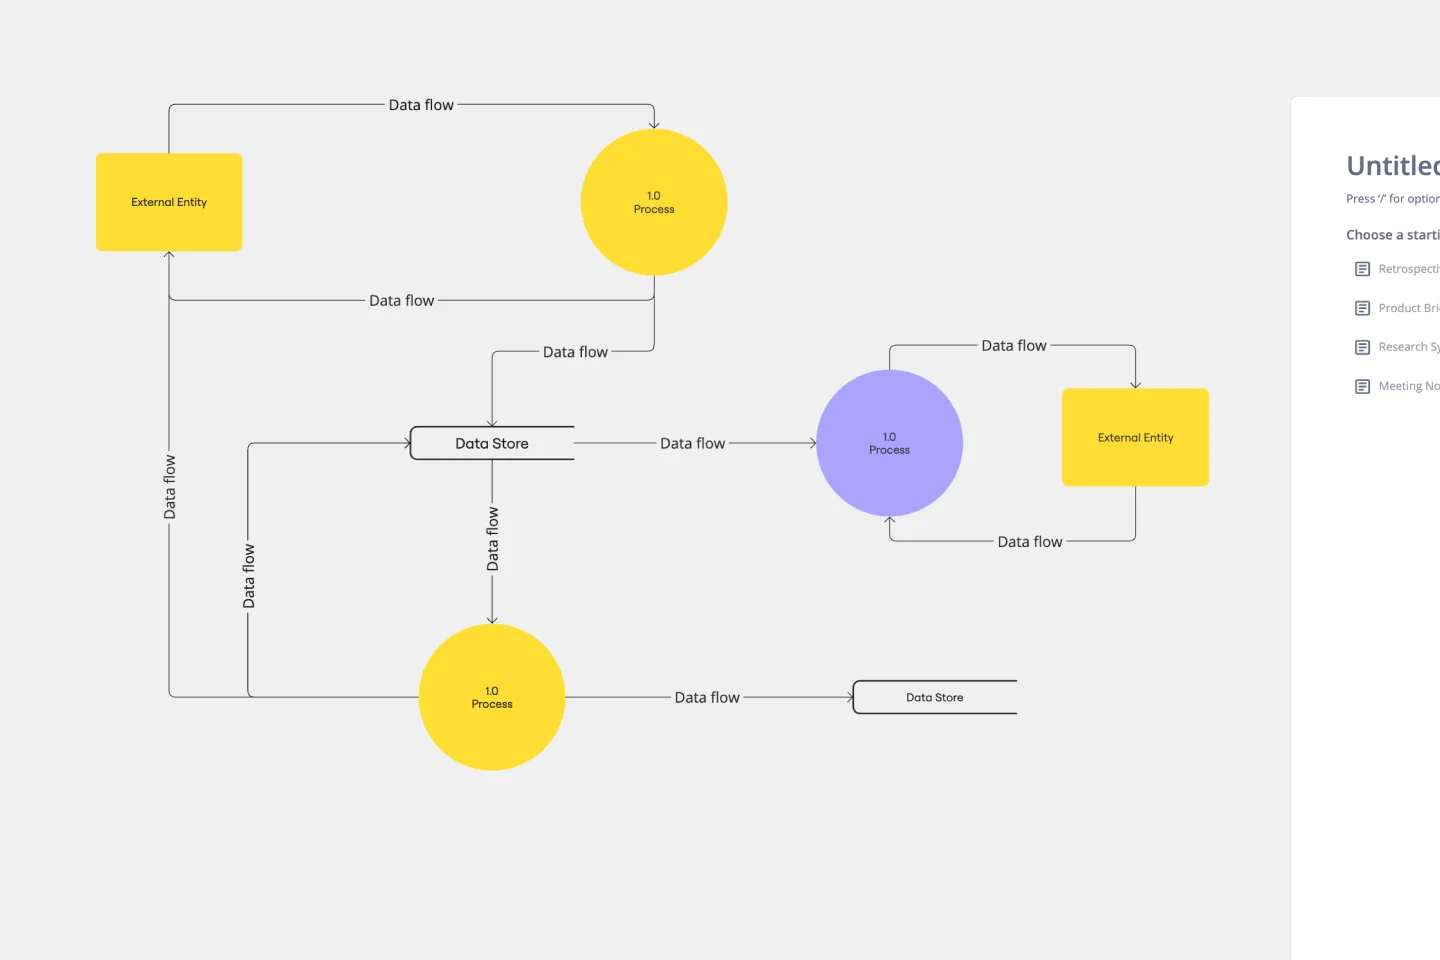
Data Flow Diagram Template
Works best for:
Flowcharts, Software Development, Diagrams
Any process can get pretty complex, especially when it has multiple components. Get a better grasp of your process through a data flow diagram (DFD). DFDs create a simple visual representation of all components in the flow of data and requirements in an entire system. They’re most often used by growth teams, data analysts, and product teams, and they’re created with one of three levels of complexity—0, 1, or 2. This template will help you easily build the best DFD for your process.