Kubernetes Architecture Diagram Template
Visualize the deployment of your applications with Kubernetes Architecture Diagram template and optimize your processes.
Available on Enterprise, Business, Education plans.
About the Kubernetes Architecture Diagram Template
A Kubernetes Architecture Diagram template is where you can visually represent the deployment, scale, and management of containerized applications. You can use a Kubernetes Architecture Diagram template to manage apps and ensure there is no downtime in production.
This Kubernetes Architecture Diagram for K8 architecture helps you and your team manage the deployment of applications. This template can be used to organize applications and easily map out Kubernetes decentralized architecture.
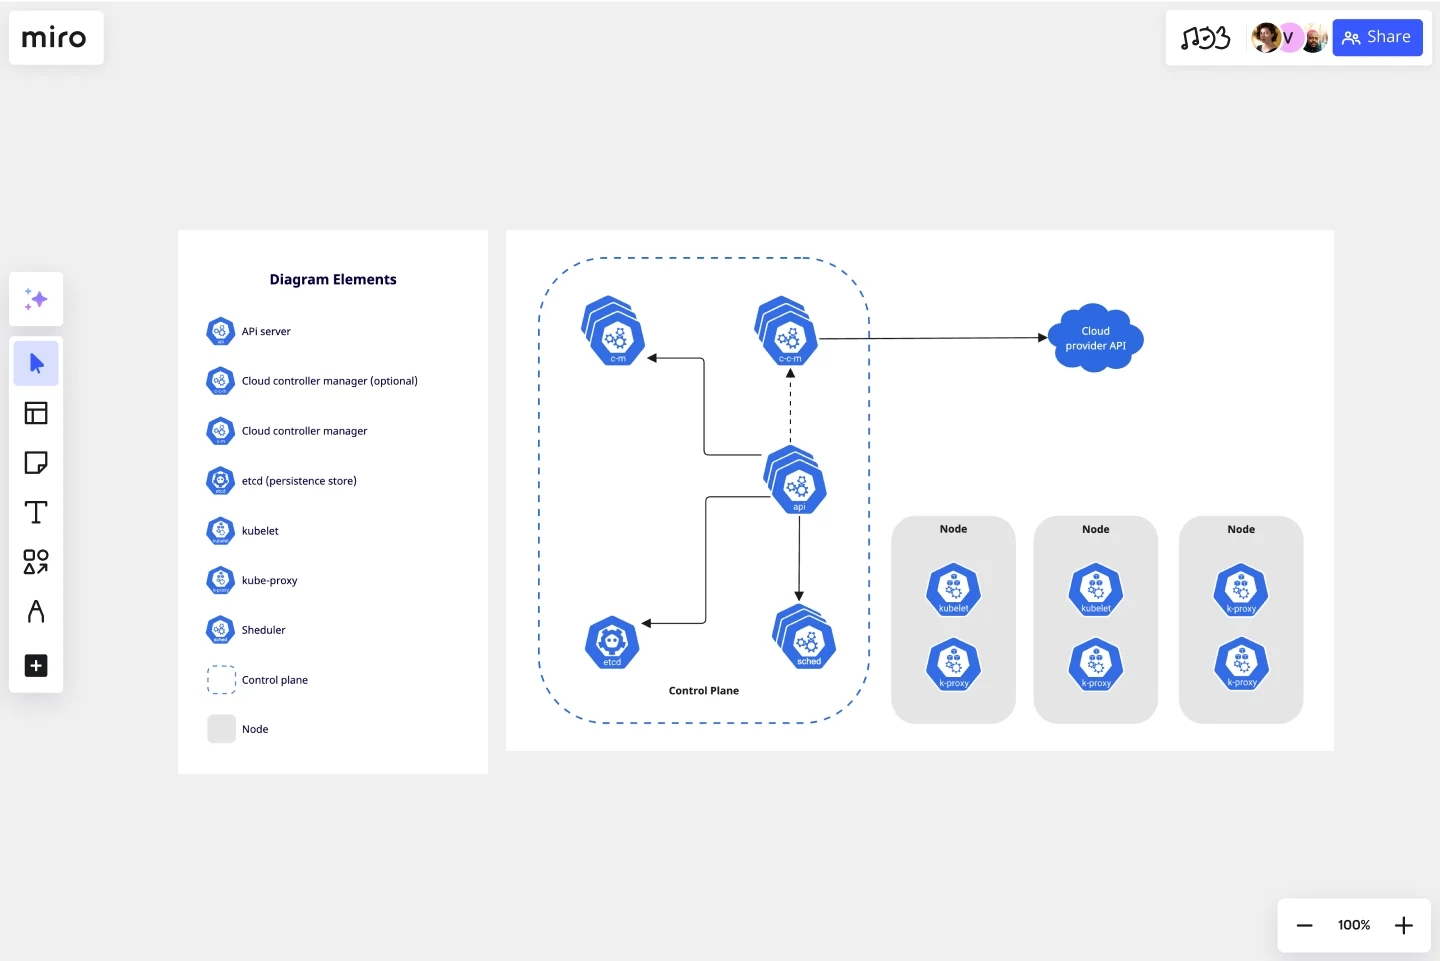
Kubernetes cluster architecture and components
When you deploy Kubernetes, you get a cluster which is a node that runs containerized applications.
Developers use containers because they provide extra benefits such as agile app creation, deployment, and continuous development and integration. Containers are coordinated automatically and monitored constantly, and the K8s architecture makes it easy to deploy and scale containerized applications.
The components of a Kubernetes Architecture Diagram template are:
Cloud controller manager: links your cluster to the cloud provider
Controller manager: makes global decisions about the cluster
Etcd (persistent store): backs store for all cluster data
Kubelet: runs each node in the cluster
Kube proxy: network proxy that runs in each node of the cluster
Scheduler: watches for newly created Pods with no assigned node, and selects a node for them to run on
Control place: runs controller processes
Node: provides Kubernetes runtime environment
How do I create a Kubernetes Architecture Diagram template?
A Kubernetes Architecture Diagram template allows you to visualize the deployment of apps.
To create a basic Kubernetes diagram with Miro, you can follow these steps:
Define your Kubernetes Architecture cluster.
List your Kubernetes components, using our set of Kubernetes Icons.
Organize your diagram, adding the components.
Add connection lines between the component shapes and set the arrows in the direction of the flow.
Format and customize your Kubernetes Architecture Diagram template.
In Miro, you can quickly build a Kubernetes Diagram from scratch using our design tools and icons set, or use our Kubernetes Architecture Diagram template and customize it as you see fit.
Miro is the perfect cloud and network diagram tool with many available shape packs, icons, and templates, ranging from Kubernetes architecture to AWS to Cisco, and many more!
How to create a Kubernetes diagram using this template?
In Miro you can create a Kubernetes Architecture Diagram using our template from our Templates Library or build your own diagram from scratch. Add Kubernetes icons by selecting our icons set on the left sidebar, connecting them with connector lines, and placing arrows in the flow direction. Miro’s collaborative whiteboard allows you to work together in real-time or asynchronously. Try it for yourself to see how it can work for you.
Why is it important to diagram Kubernetes architecture?
Developers create a Kubernetes Architecture Diagram to better manage and deploy application containers and continuously improve development, integration, and app deployment. Having a Kubernetes diagram helps to work across teams and to keep collaboration seamlessly when managing applications.
Get started with this template right now. Available on Enterprise, Business, Education plans.
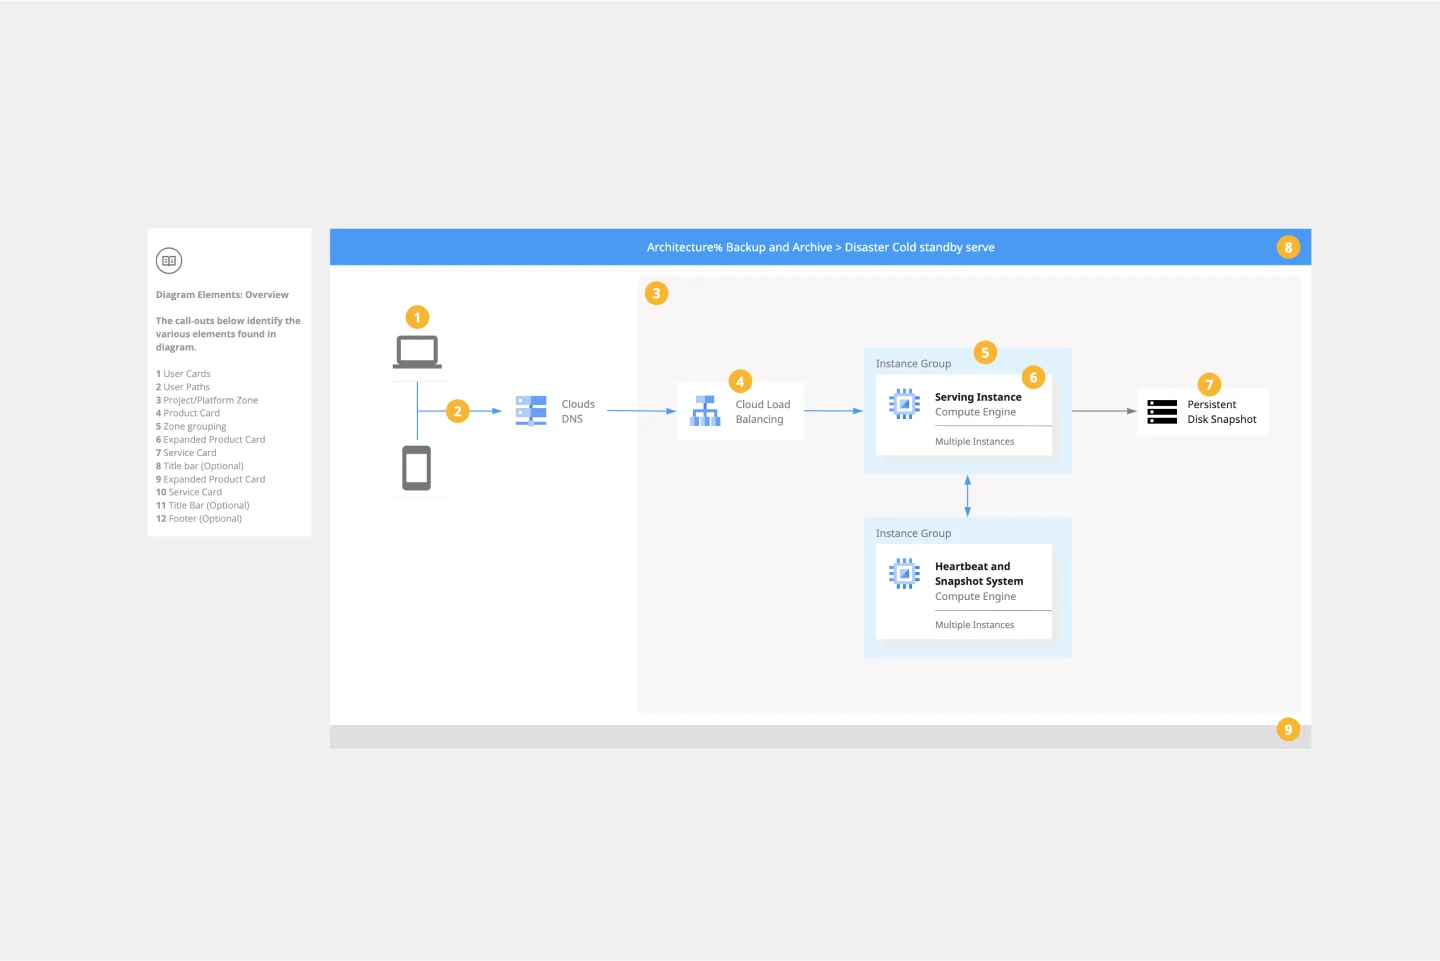
Google Cloud Architecture Diagram Template
Works best for:
Software Development, Diagrams
Use the Google Cloud Architecture Diagram template to clearly visualize the deployment of your application and allow you and your team to optimize processes. The GCP template gives you a great overview of your application architecture, and it helps you to iterate quickly and better manage your application development, deployment, and documentation. Try it out and see if it works for you.
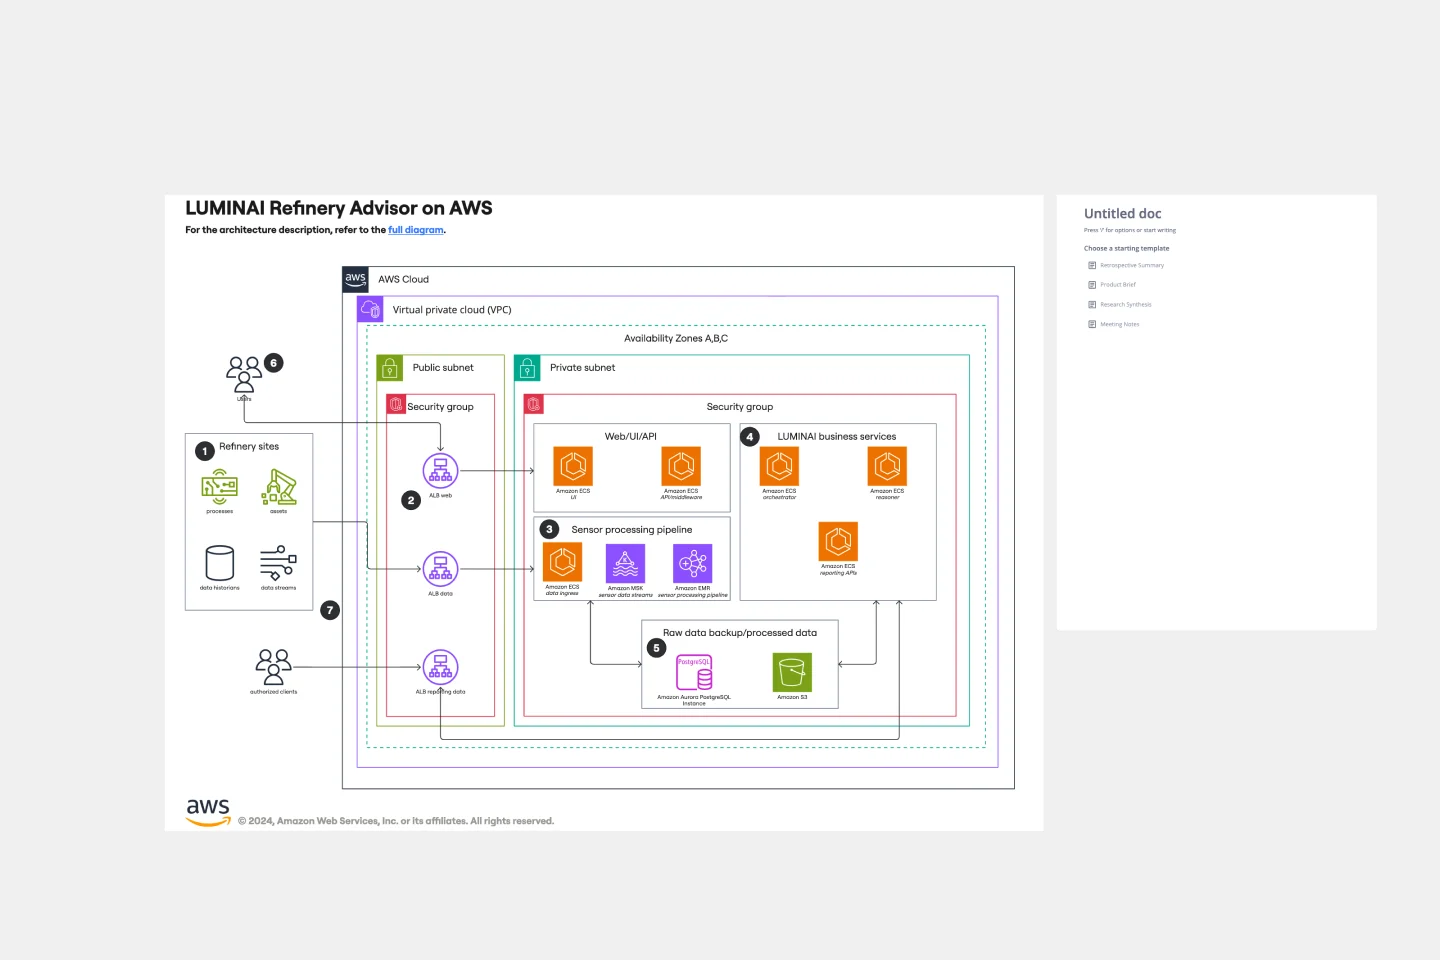
LUMINAI Refinery Advisor on AWS Template
Works best for:
AWS
The LUMINAI Refinery Advisor on AWS template streamlines and optimizes refinery operations through AWS. It provides a structured approach to setting up and managing AWS services, tailored specifically for engineers, developers, and data scientists in the refinery sector. This template not only saves time and effort by offering a predefined structure and best practices but also allows for customization to meet specific operational needs. With its focus on enhancing data processing capabilities, the LUMINAI Refinery Advisor on AWS template is an invaluable resource for improving the efficiency, effectiveness, and optimization of refinery processes on the AWS platform.
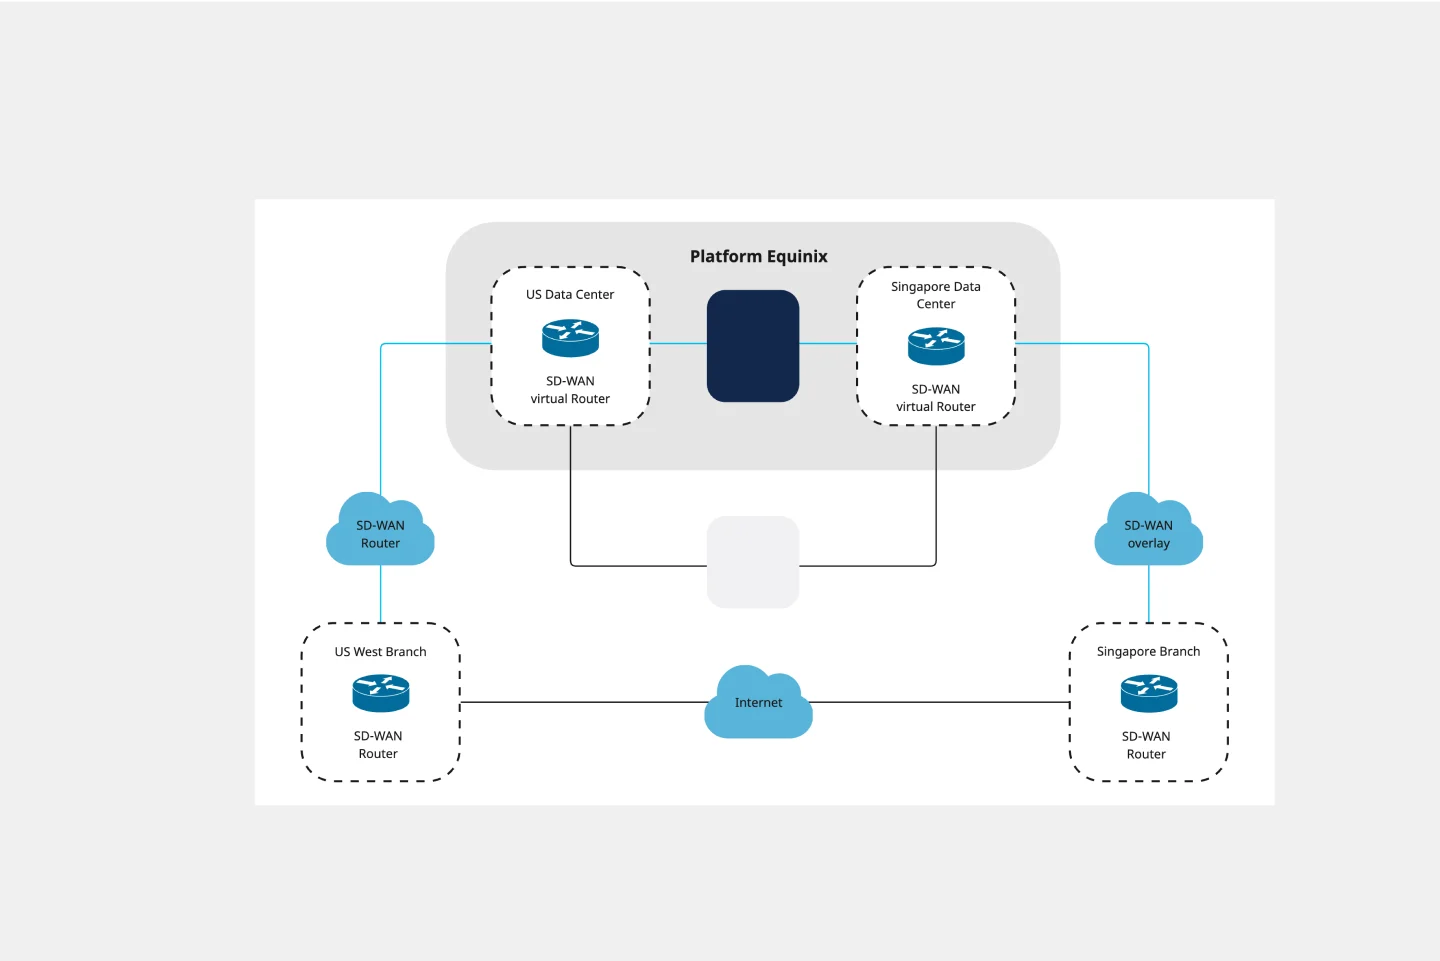
Cisco Data Network Diagram Template
Works best for:
Software Development
Cisco offers data center and access networking solutions built for scale with industry-leading automation, programmability, and real-time visibility. The Cisco Data Network Diagram uses Cisco elements to show the network design of Cisco Data Networks visually.
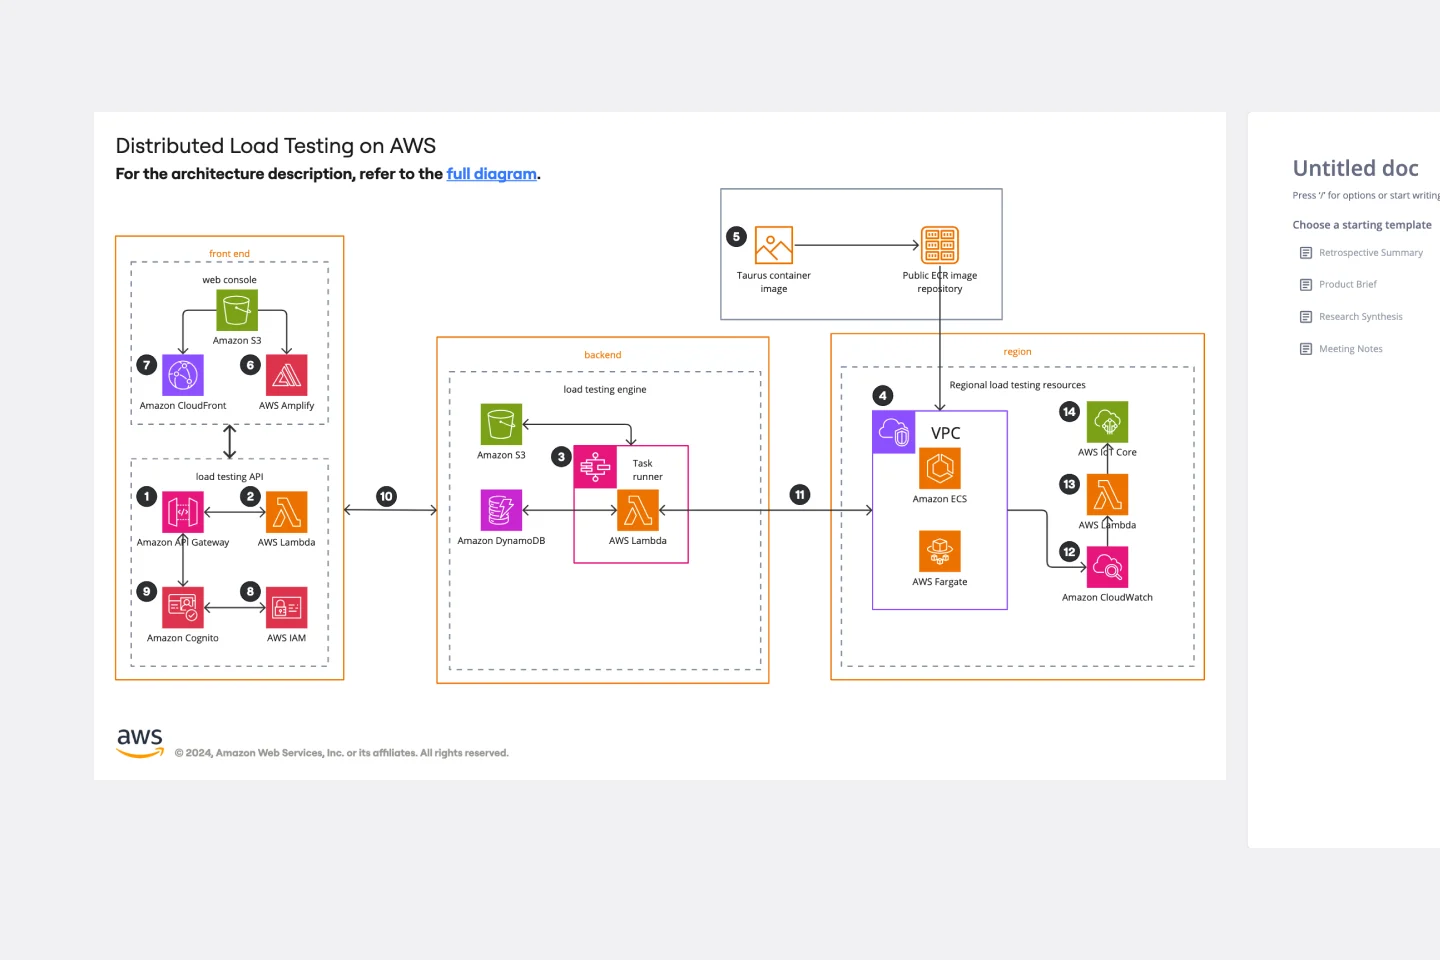
AWS Architecture Diagram Template
Works best for:
Software Development, Diagrams
The AWS Architecture Diagram is a visual representation of the AWS framework, and it also translates the best practices when using Amazon Web Services architecture. You can now have an overview of your AWS architecture with Miro’s AWS Architecture Diagram Template, track your cloud solutions easily, and optimize processes like never before.
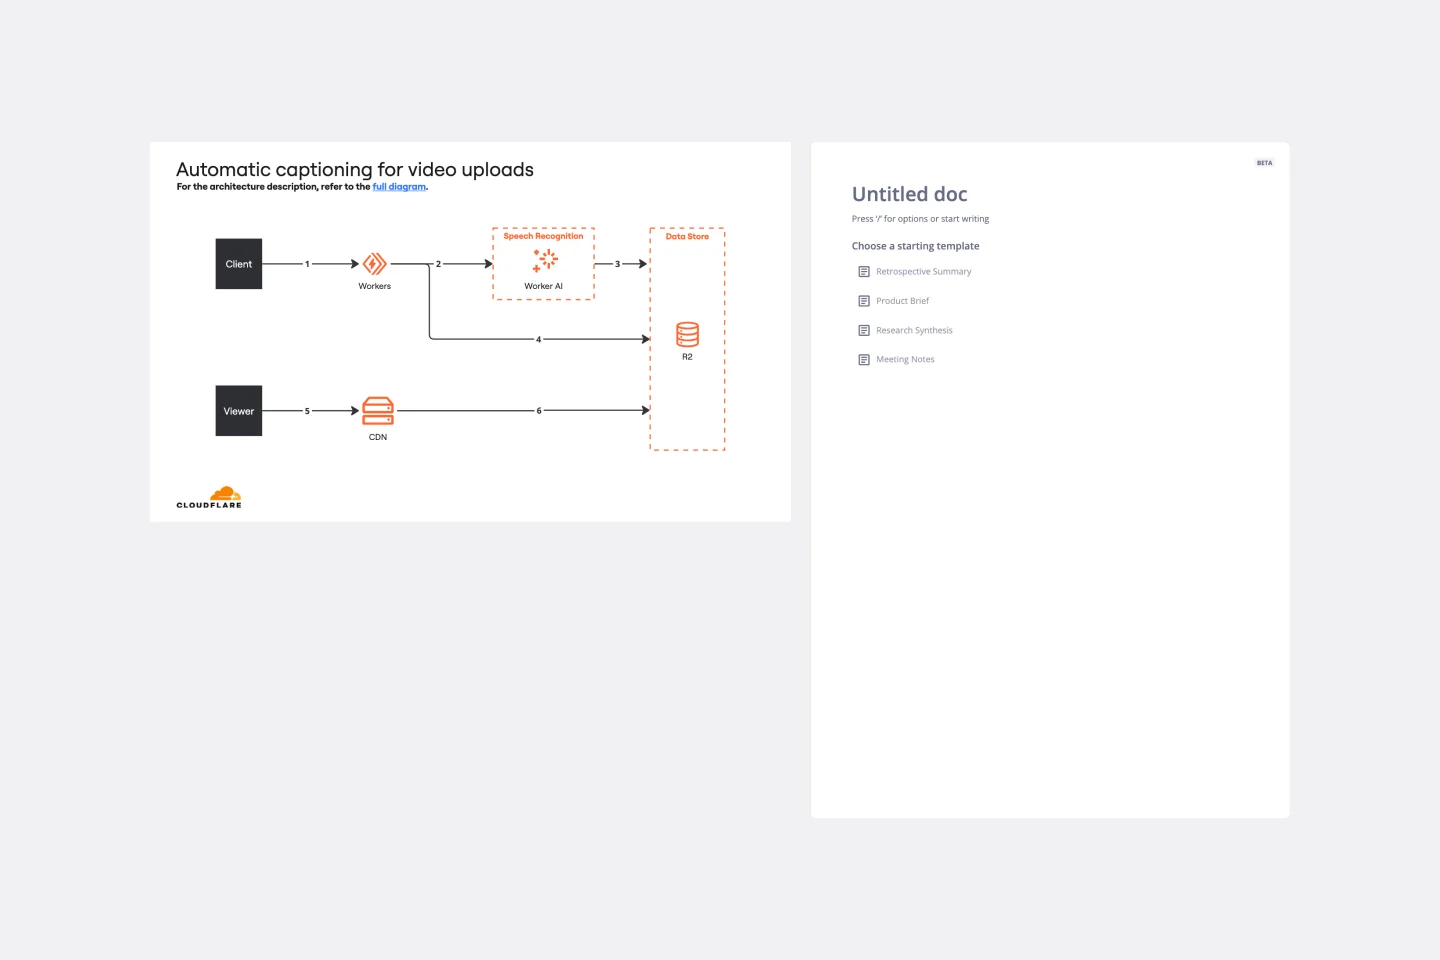
Cloudflare Automatic Captioning for Video Template
The Cloudflare Automatic Captioning for Video Template in Miro is a powerful tool designed to enhance the accessibility and engagement of video content. By leveraging Cloudflare's technology, this template helps outline the captioning process for videos. It not only makes content accessible to a broader audience, including those who are deaf or hard of hearing but also boost viewer engagement by making videos consumable in sound-sensitive environments or by individuals who prefer reading along.
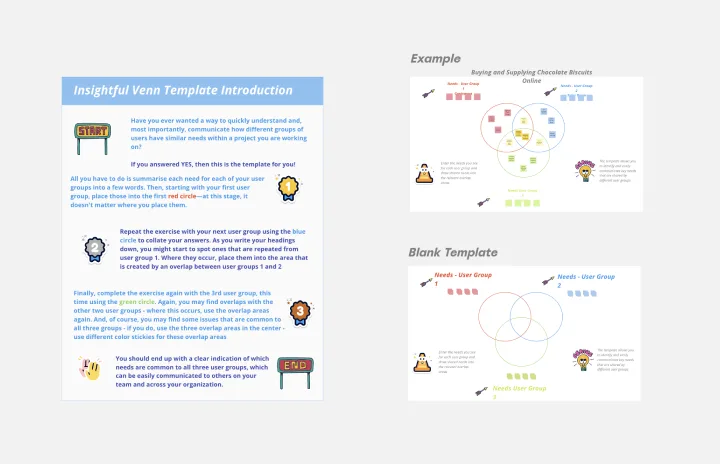
Insightful Venn
Works best for:
Venn Diagram
Discover insights and visualize data relationships with the Insightful Venn template. This tool helps you compare multiple datasets, identify intersections, and understand unique and common elements. Use it for data analysis, research, and presentations to communicate complex information effectively. Perfect for analysts, educators, and researchers aiming to convey data-driven insights visually.