Org Unit Visual Guide
This visual guide is especially suitable for large company departments, areas or tribes that need to document what their department does, how they work and who is part of their teams in an engaging and easy way.
The visual guide includes:
A navigation flow that imitates a board game
A template for a Simple Go Roadmap
A template for an Org Chart
A template for a Photo Gallery
A template for a Framework Overview
A Template for Regular Meetings Overview
How to use this template:
Just change anything you need;
Remember to block all the items in the board that you do not want others to edit
To use this template, it is recommended that you know or learn how to use Frames, Hyperlinks and that you know how to embed Google Documents in Miro.
This template was created by Mariana Solana Ros.
Get started with this template right now.
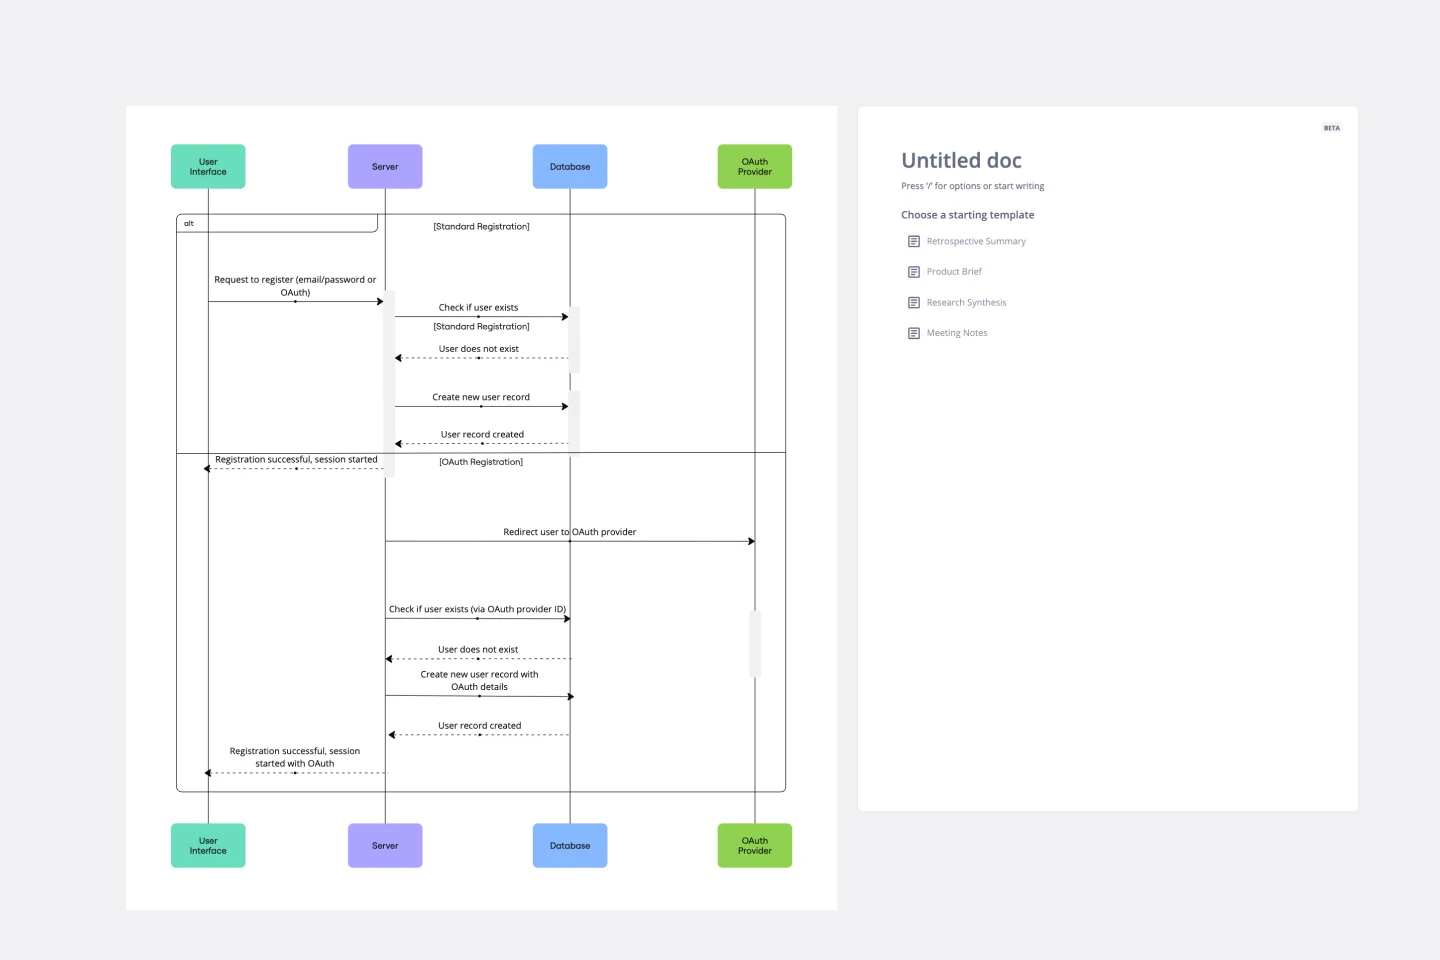
UML Sequence Registration Process Template
Works best for:
UML
The UML Sequence Registration Process Template helps visualize and document user registration processes. It enables the rapid creation of sequence diagrams, which are crucial for enhancing clarity and identifying potential issues early in the design phase. This template not only supports collaborative efforts through Miro's platform, facilitating real-time teamwork, but also ensures a comprehensive system design. Being part of a broader collection of UML diagram templates, it stands as a valuable asset for projects involving registration workflows, contributing to streamlined project execution and effective communication among team members.
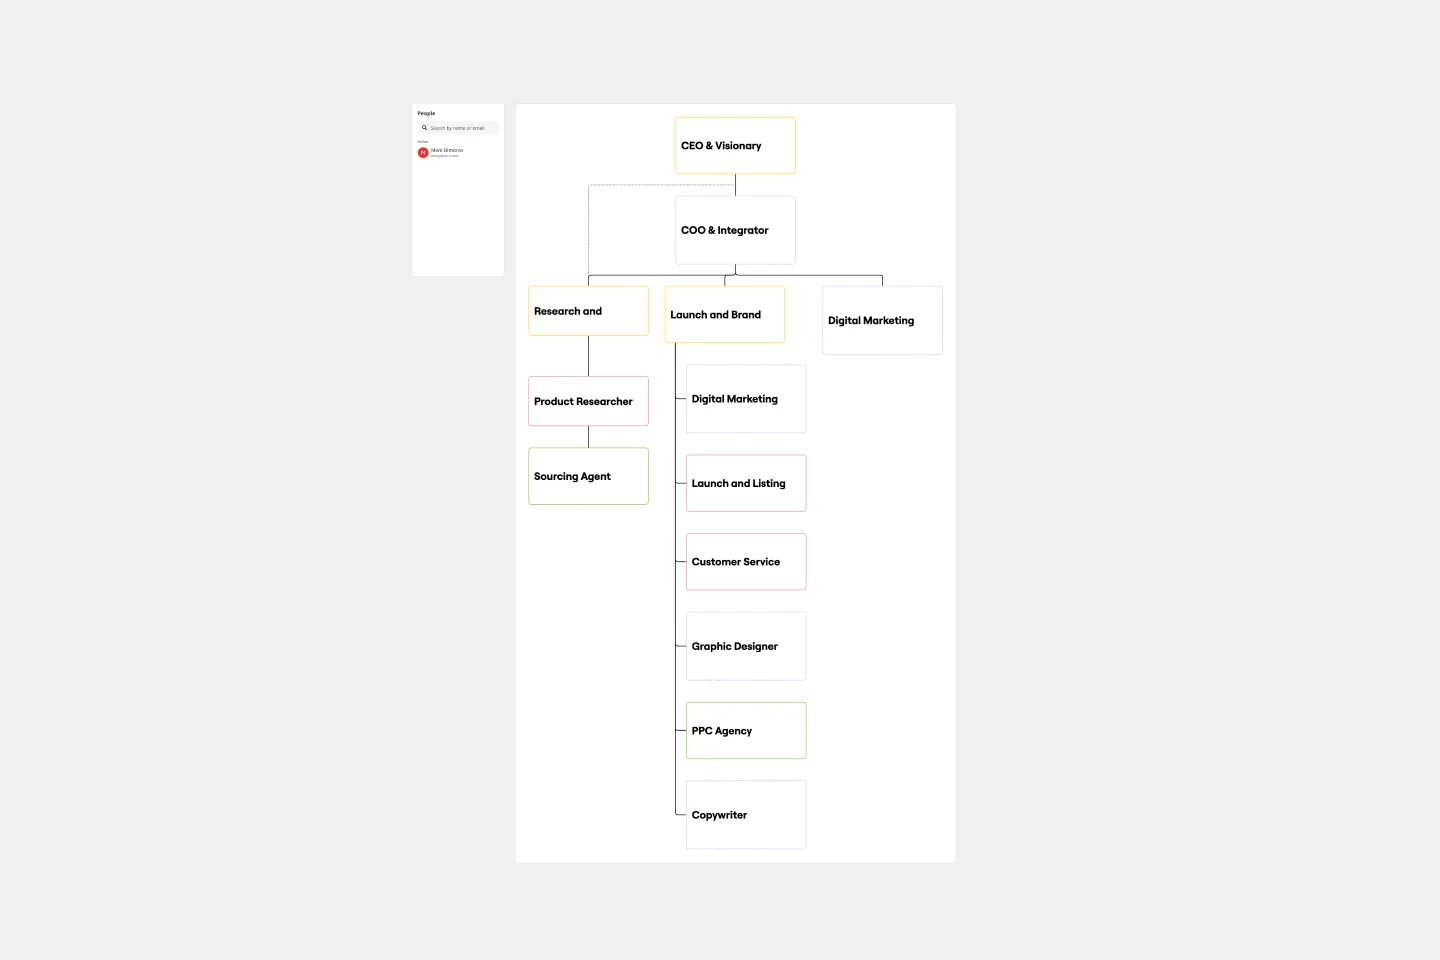
Accountability Chart Template
Works best for:
Organizational Chart, Org Design
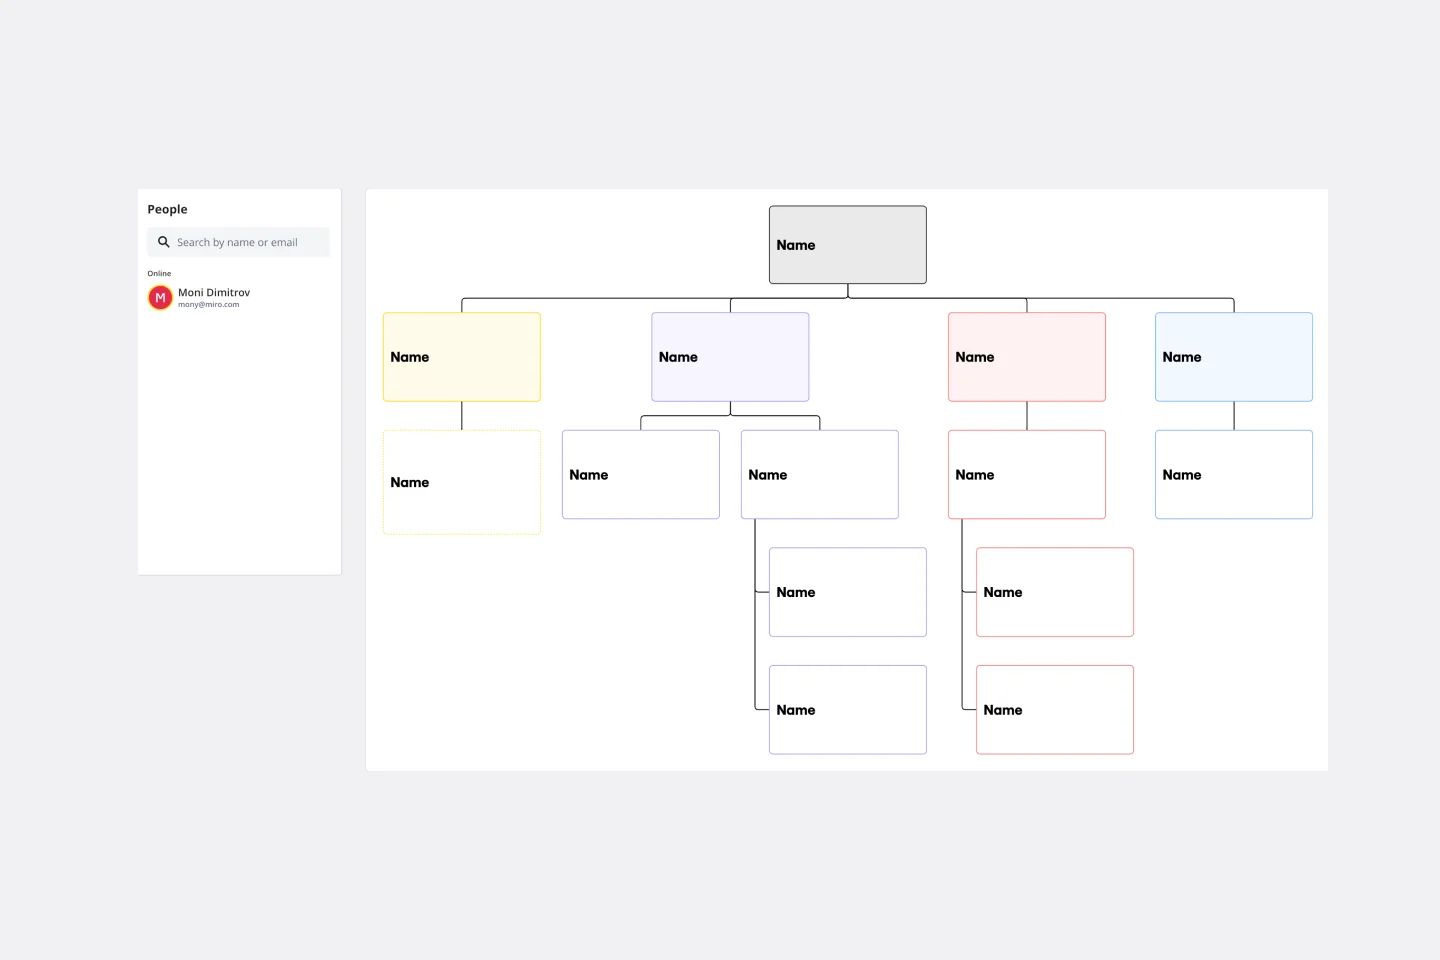
The Accountability Chart Template is a visual map detailing the various roles within an organization and the responsibilities tied to each. This systematic layout ensures clarity in defining duties and fosters a culture of accountability. A standout benefit of using this template is its capacity to eliminate role ambiguity. The Accountability Chart template ensures that every team member understands tasks by clearly depicting who is responsible for what. This leads to enhanced productivity and reduced task overlaps or missed assignments.
Cluster Diagram Template
Works best for:
Diagramming
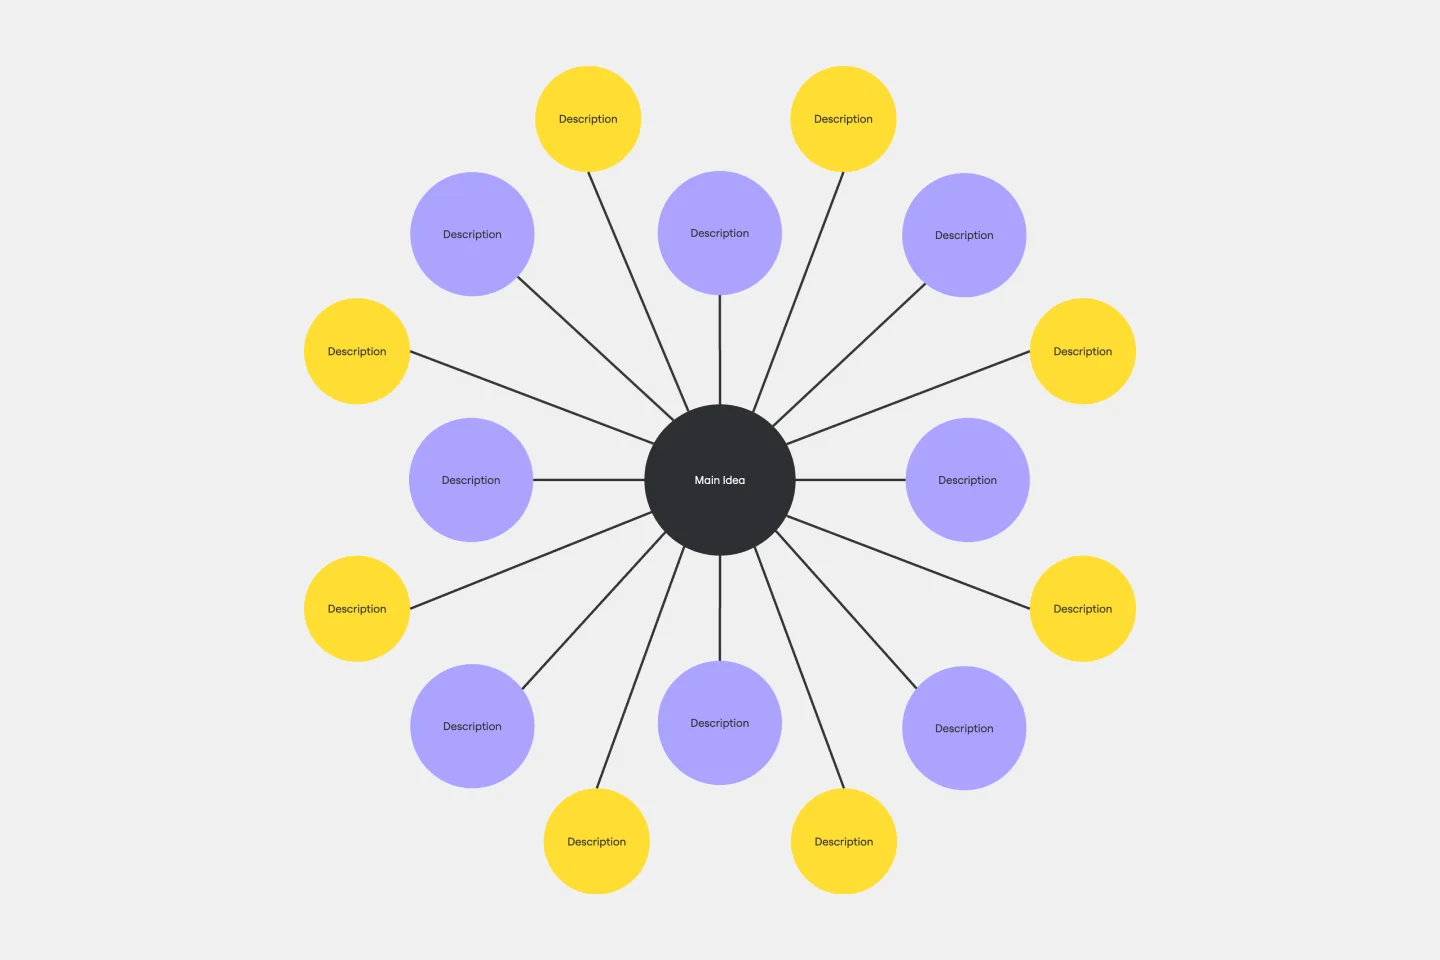
The Cluster Diagram Template is a valuable tool for organizing and connecting ideas, concepts, and information in a visually compelling and coherent manner. The template's design centers on grouping related ideas around a core concept, creating a transparent and hierarchical structure. This clustering not only aids in breaking down complex information into manageable segments but also significantly enhances the process of idea generation and brainstorming. A structured yet flexible visual framework encourages deeper engagement and more precise understanding, making it an essential asset for teams and people looking to bring order to their creative and analytical processes.
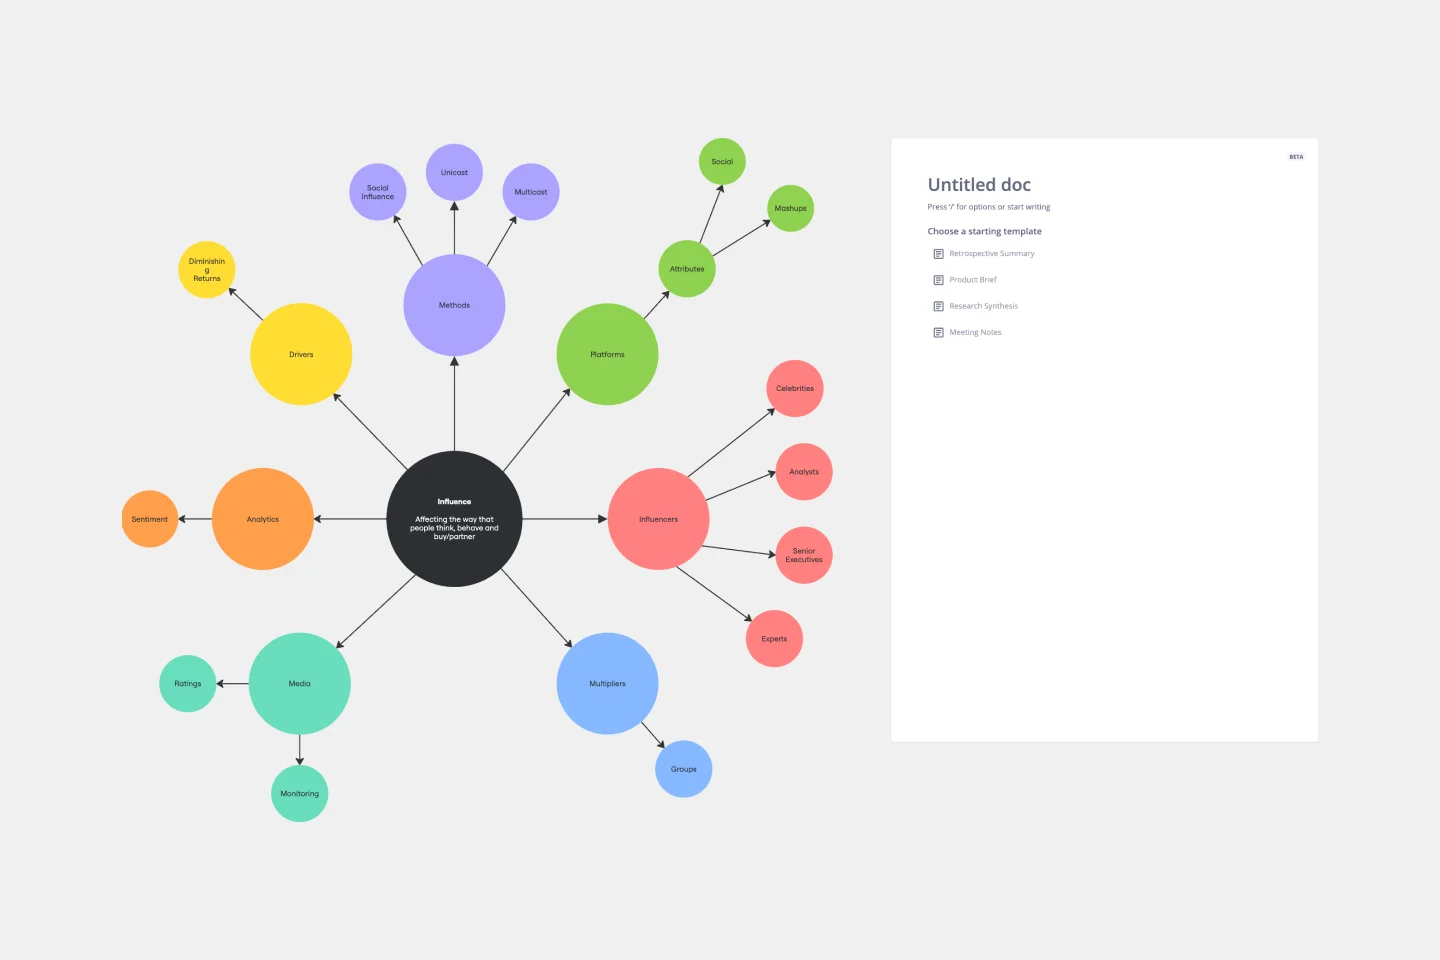
Bubble Map Template
Works best for:
Diagramming, Mapping, Brainstorming
A Bubble Map Template is a visual organization tool that uses bubbles or circles to represent various ideas or data points. These bubbles are linked together, displaying their relationships and creating a network of interconnected thoughts. Use a Bubble Map Template to streamline complex information, enhancing comprehension and promoting efficient decision-making.
Agile Transition Plan Template
Works best for:
Agile Methodology, Agile Workflows
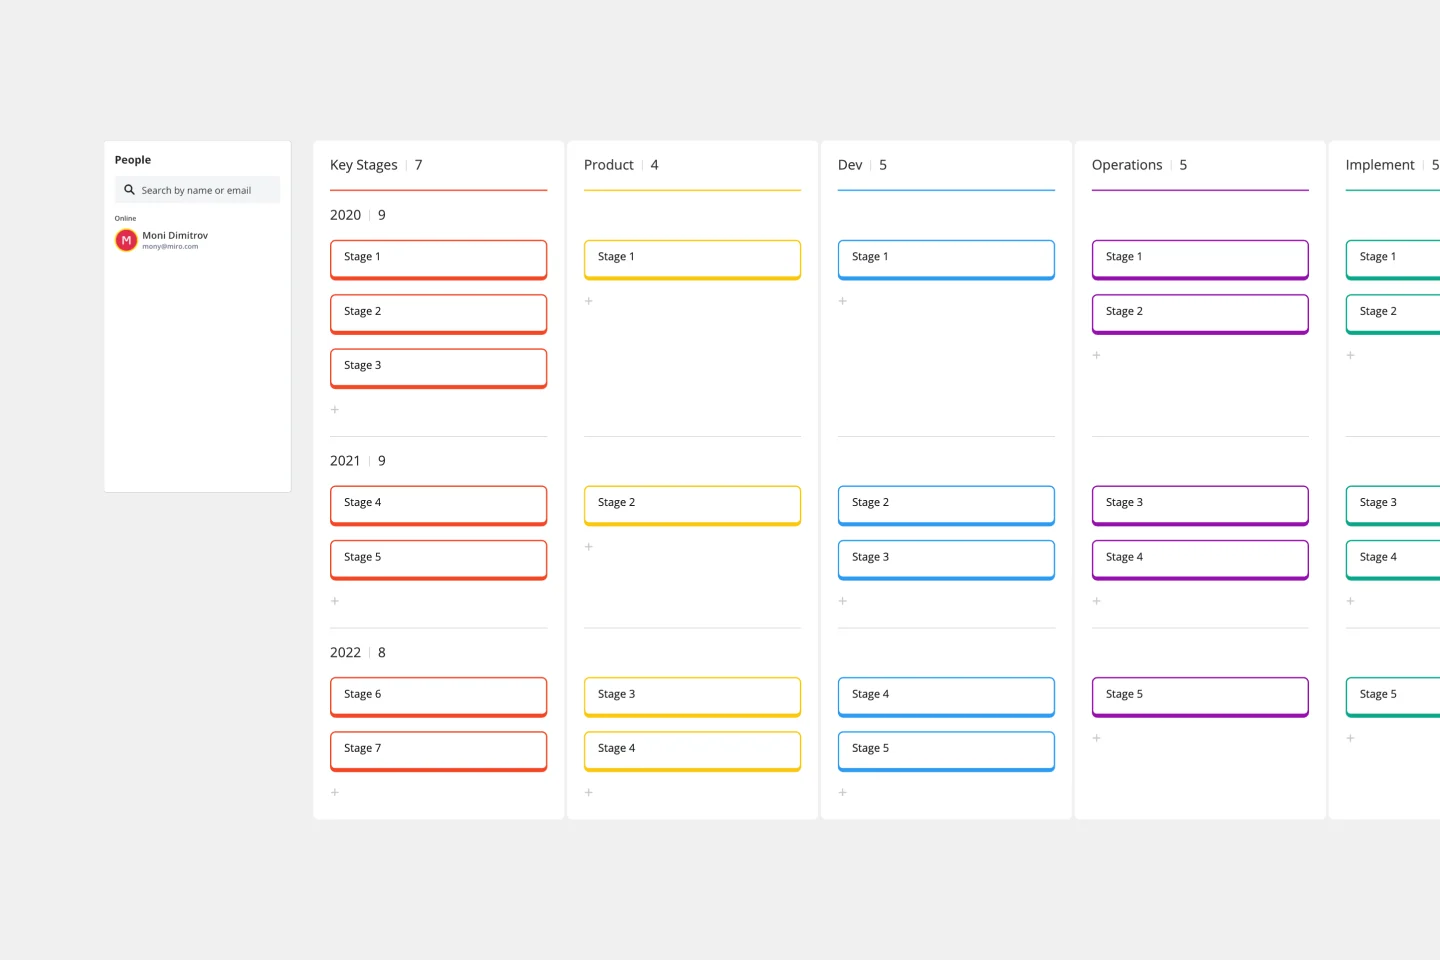
An Agile transformation roadmap can help you, your team, and your organization transition from rigid compliance-heavy methods to the more flexible Agile way of doing things incrementally. From requirements to integrations to security, you can map out your organization's moving parts as “swim lanes” that you can then update regularly. Use your roadmap as a way to tell the story of how you see your product growing over a period of time. Get buy-in without overselling and keep your roadmap simple, viable and measurable. By using an Agile transformation roadmap, you can avoid getting bogged down in details and instead invest in big-picture strategic thinking.
Company Organizational Chart
Works best for:
Org Charts, Operations, Mapping
An org chart is a visual guide that sums up a company’s structure at a glance—who reports to whom and who manages what teams. But it does more than just display the chain of command. It also showcases the structure of different departments and informs employees who to reach out to with issues and concerns. That makes it an especially valuable tool for new hires who are getting familiar with the company. Our templates make it easy for you to add your entire team and customize the chart with colors and shapes.