T-Chart Template
Make better, faster decisions by organizing and comparing your ideas.
About the T-Chart Template
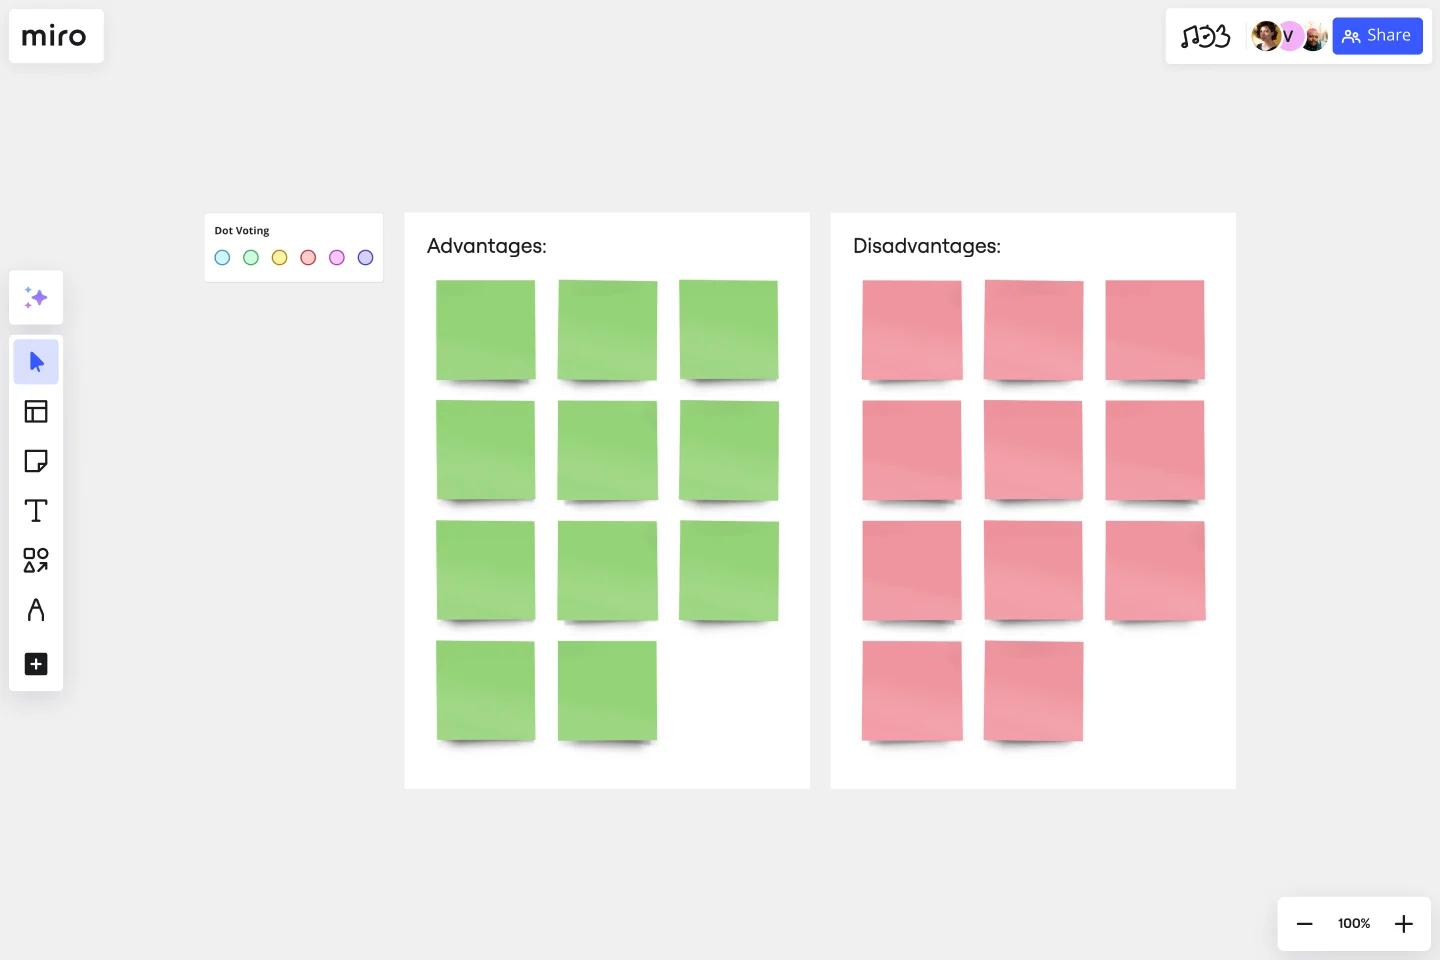
T-Charts can help you compare and contrast two different ideas, group information into different categories, and prove a change through “before” and “after” analysis. Designers and content creators can use T-Charts to turn possibilities into actionable ideas.
What is a T-Chart
T-Charts are a visual organizational tool that can help problem solve and compare aspects of two ideas. You can make comparisons such as pros and cons, facts and opinions, strengths and weaknesses, or big-picture views versus specific details.
When to use a T-Chart
T-Charts are useful for discussing differences and similarities with your team or clients and can help you to reach a decision together. Try testing out different headings or themes depending on the kind of problem you’d like to solve. This can include:
Compare pros and cons
Analyze personality traits
Contrast before and after states
Define cause and effect
Compare then and now states
Build a glossary to keep track of words and definitions
Outline hypothetical solutions and their potential outcomes
T-Charts allow your team to record new insights, spot patterns, and share knowledge. T- Charts often complement statistical data and graphs that can be presented with a formed narrative.
Create your own T-Chart
Making your own T-Charts is easy. Miro is the perfect canvas to create a T-chart and share them. Get started by selecting the T-Chart Template, then take the following steps to make one of your own:
Decide why you need a T-Chart. Are you comparing and contrasting design or content-related ideas to make a decision? Or outlining situations to plan ahead of important events? Either way, thinking ahead can create a strong foundation for your chart.
Invite your team or clients to fill in the blanks. Up to 300 people can collaborate seamlessly on your Miro board. If you need input or feedback to narrow down your ideas, invite others to participate.
Add visuals to strengthen your text, or make a final decision. Adding emojis or photos will bring an emotional layer or more context for your team. You can use imagery as a tool to vote for a preferred option. Imagery can also help bring the chart to life with real-life references.
Get started with this template right now.
2x2 Prioritization Matrix Template
Works best for:
Operations, Strategic Planning, Prioritization
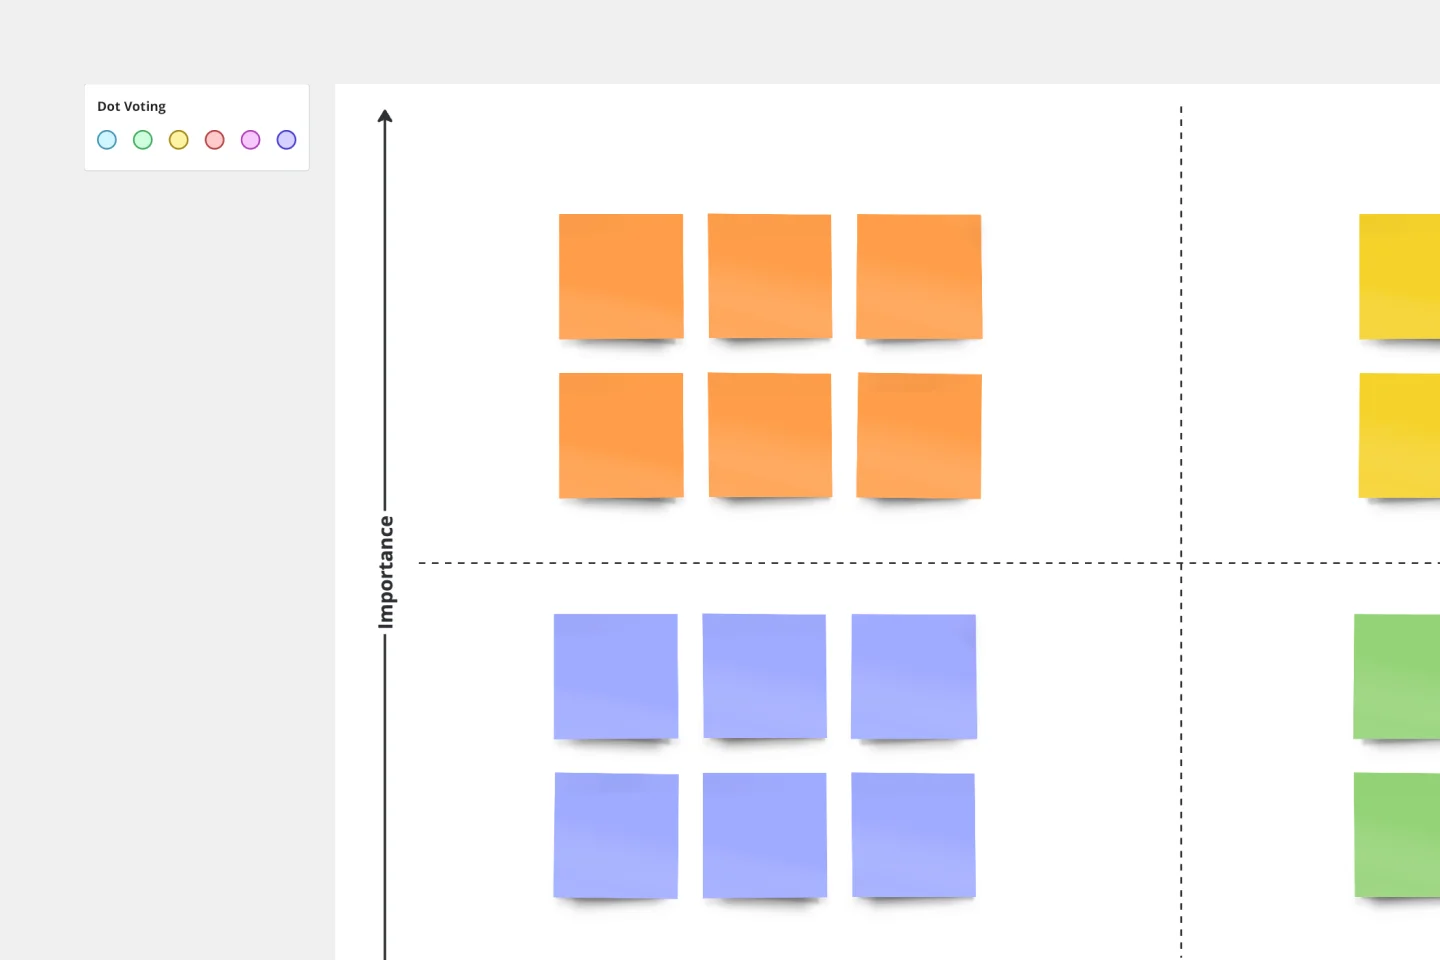
Ready to set boundaries, prioritize your to-dos, and determine just what features, fixes, and upgrades to tackle next? The 2x2 prioritization matrix is a great place to start. Based on the lean prioritization approach, this template empowers teams with a quick, efficient way to know what's realistic to accomplish and what’s crucial to separate for success (versus what’s simply nice to have). And guess what—making your own 2x2 prioritization matrix is easy.
UML Class E-Commerce System Template
Works best for:
UML
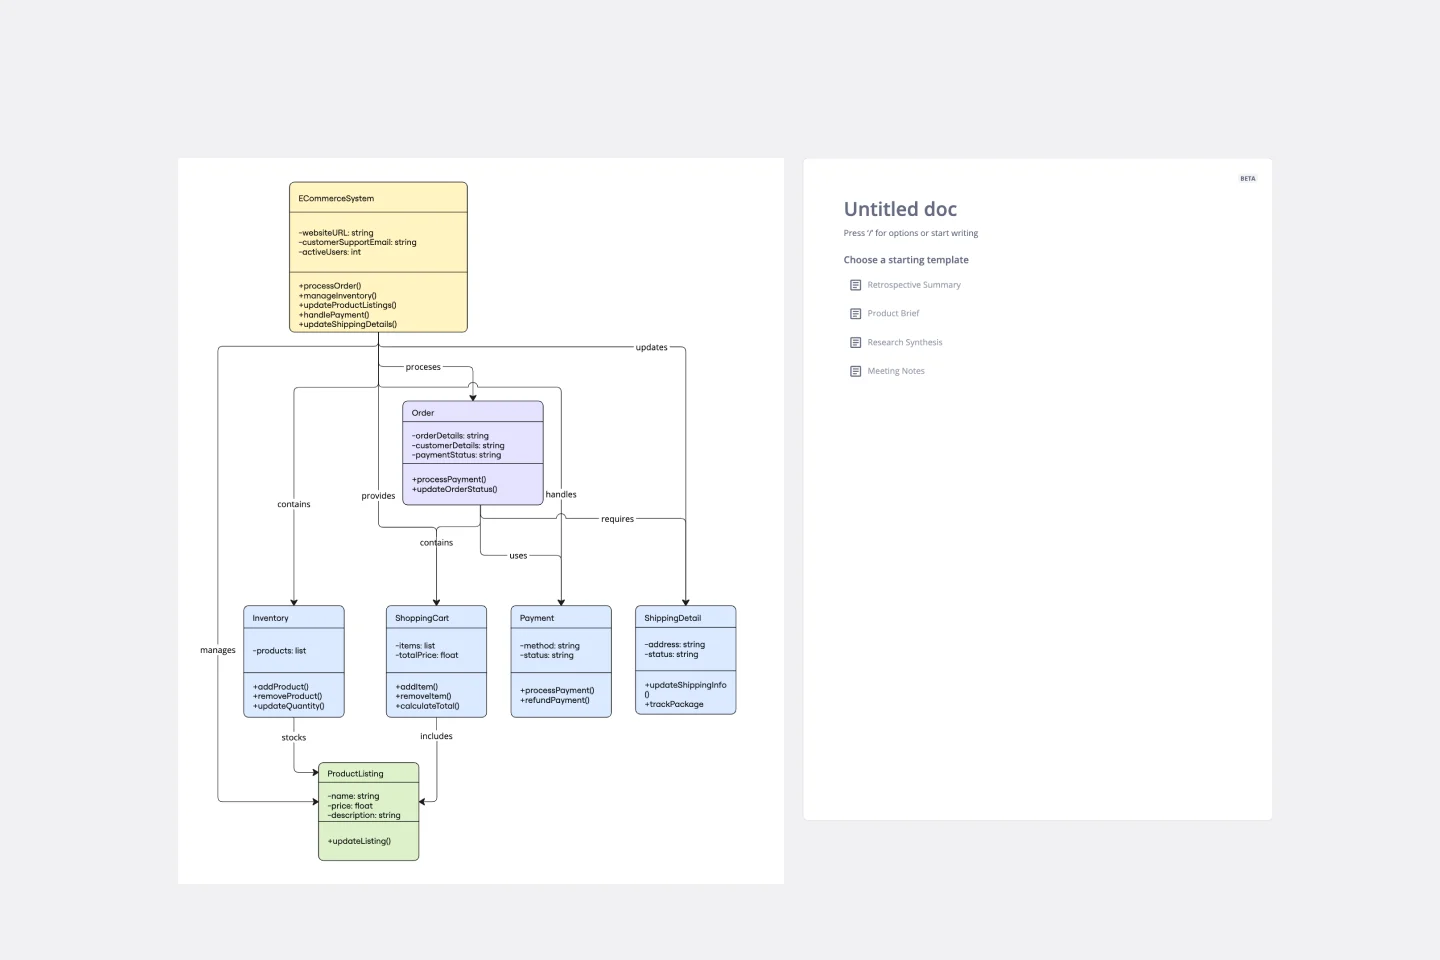
The UML Class E-Commerce System Template streamlines the process of creating and visualizing the class structure of an e-commerce system. It provides a comprehensive framework that includes typical online shop features such as product listings, inventory management, shopping carts, orders, payments, and shipping details. This template facilitates a clear understanding of how these elements interact during an online sales transaction, making it an invaluable tool for teams working on e-commerce projects. By using this template, teams can save time, enhance collaboration, and ensure that their system architecture is robust and efficient, ready to adapt to their business's evolving needs.
SOAR Analysis Template
Works best for:
Leadership, Decision Making, Strategic Planning
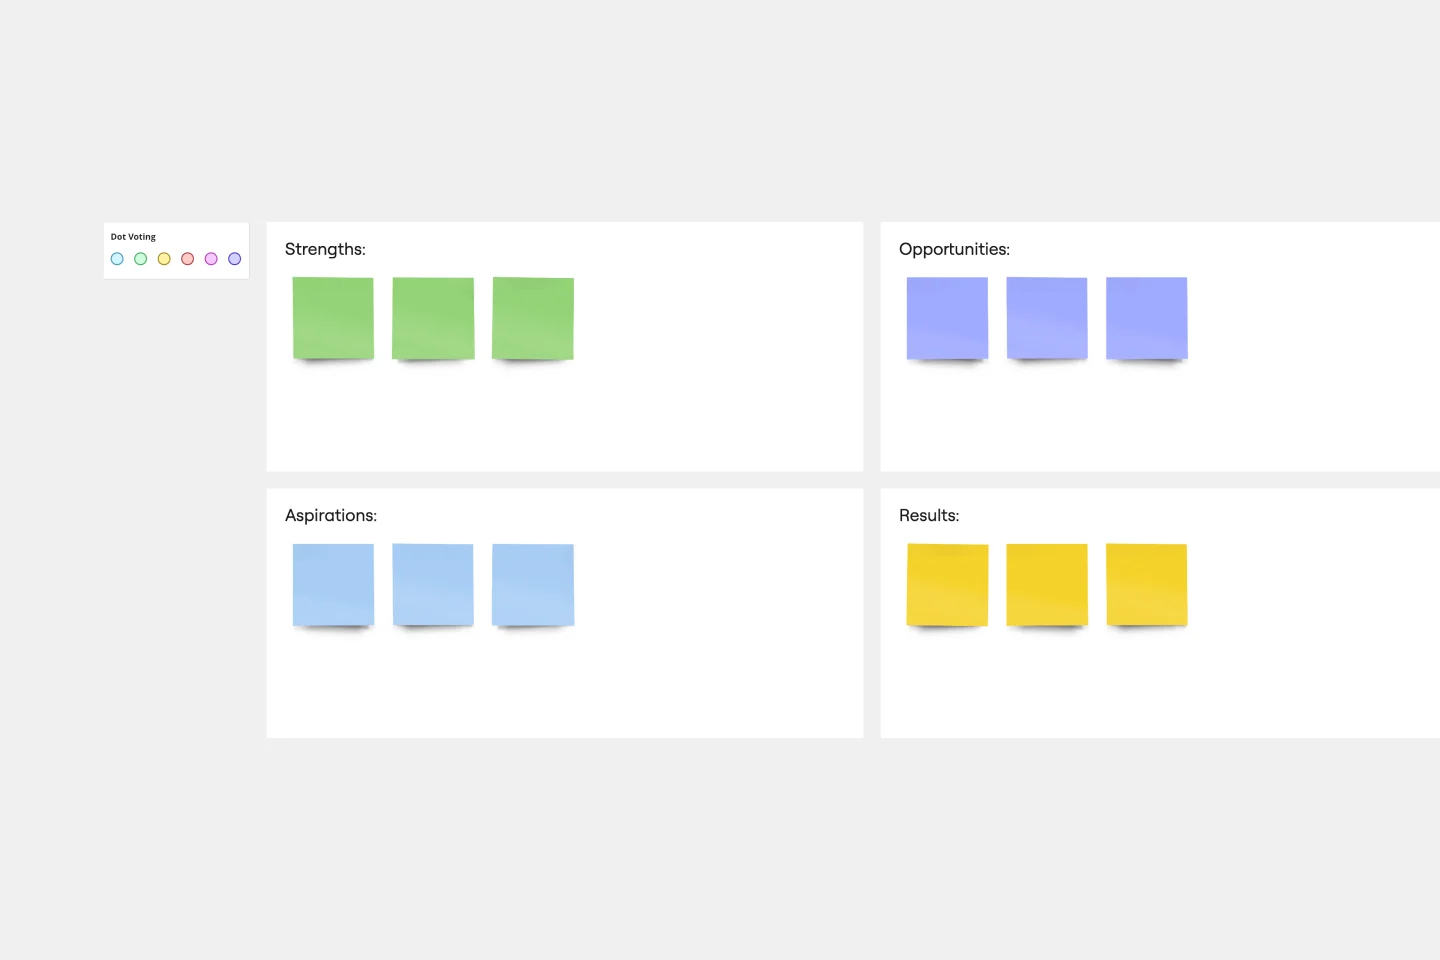
The SOAR Analysis template prompts you to consider your organization’s strengths and potential to create a shared vision of the future. The SOAR Analysis is unique in that it encourages you to focus on the positive rather than solely identifying areas for growth. SOAR stands for Strengths, Opportunities, Aspirations, and Results. To use the template, examine each category through a positive lens. Perform a SOAR Analysis whenever you want to bring people together and encourage action.
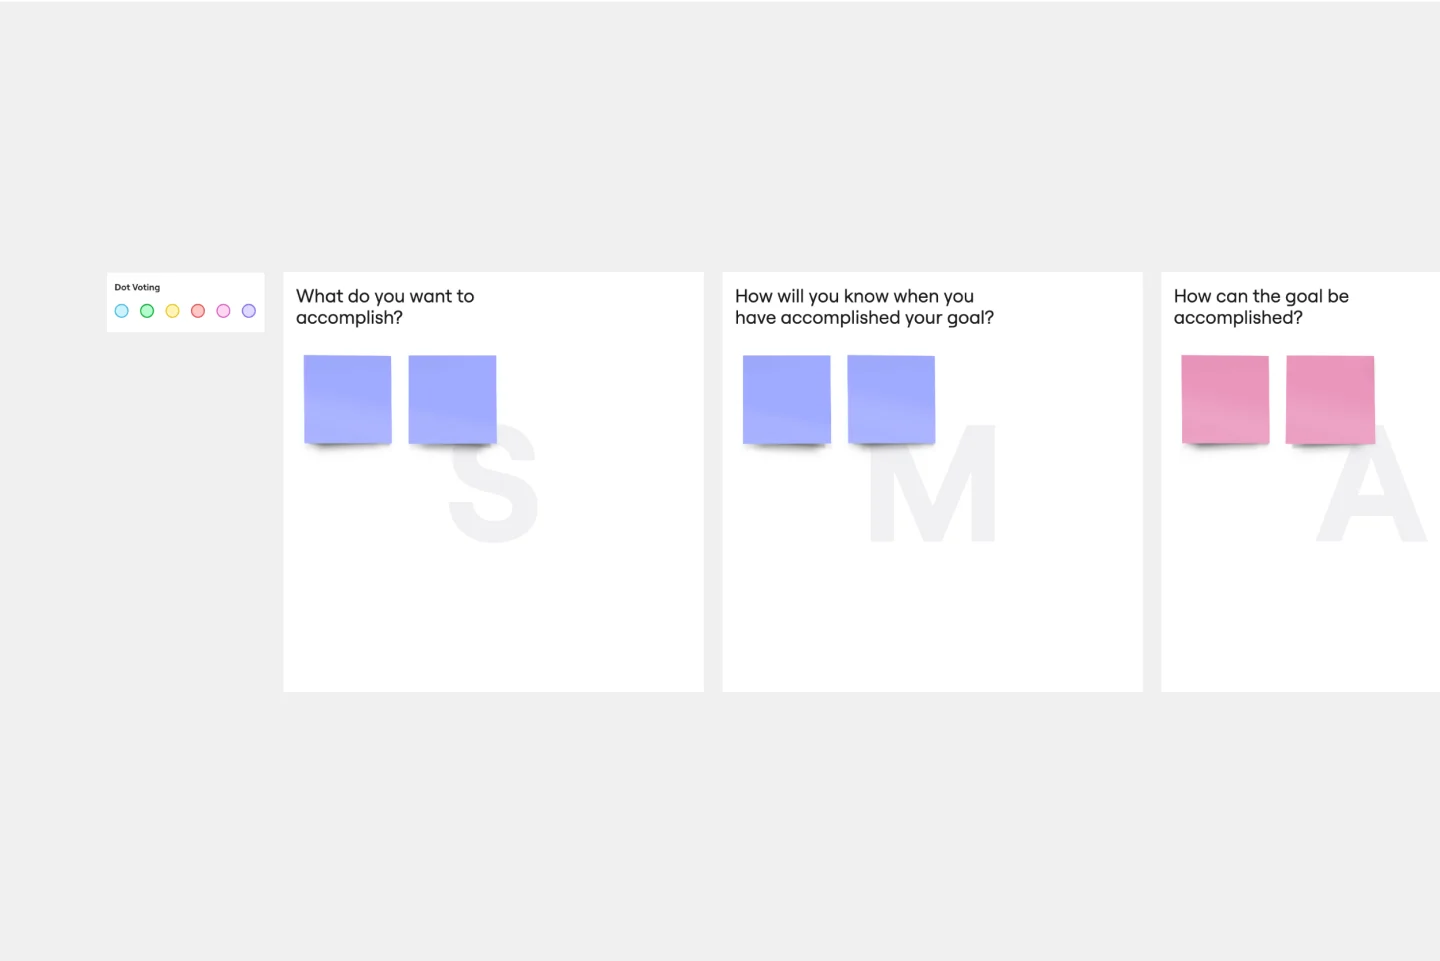
SMART Goals Template
Works best for:
Prioritization, Strategic Planning, Project Management
Setting goals can be encouraging, but can also be overwhelming. It can be hard to conceptualize every step you need to take to achieve a goal, which makes it easy to set goals that are too broad or too much of a stretch. SMART is a framework that allows you to establish goals in a way that sets you up for success. SMART stands for Specific, Measurable, Attainable, Relevant, and Timely. If you keep these attributes in mind whenever you set goals, then you’ll ensure your objectives are clear and reachable. Your team can use the SMART model anytime you want to set goals. You can also use SMART whenever you want to reevaluate and refine those goals.
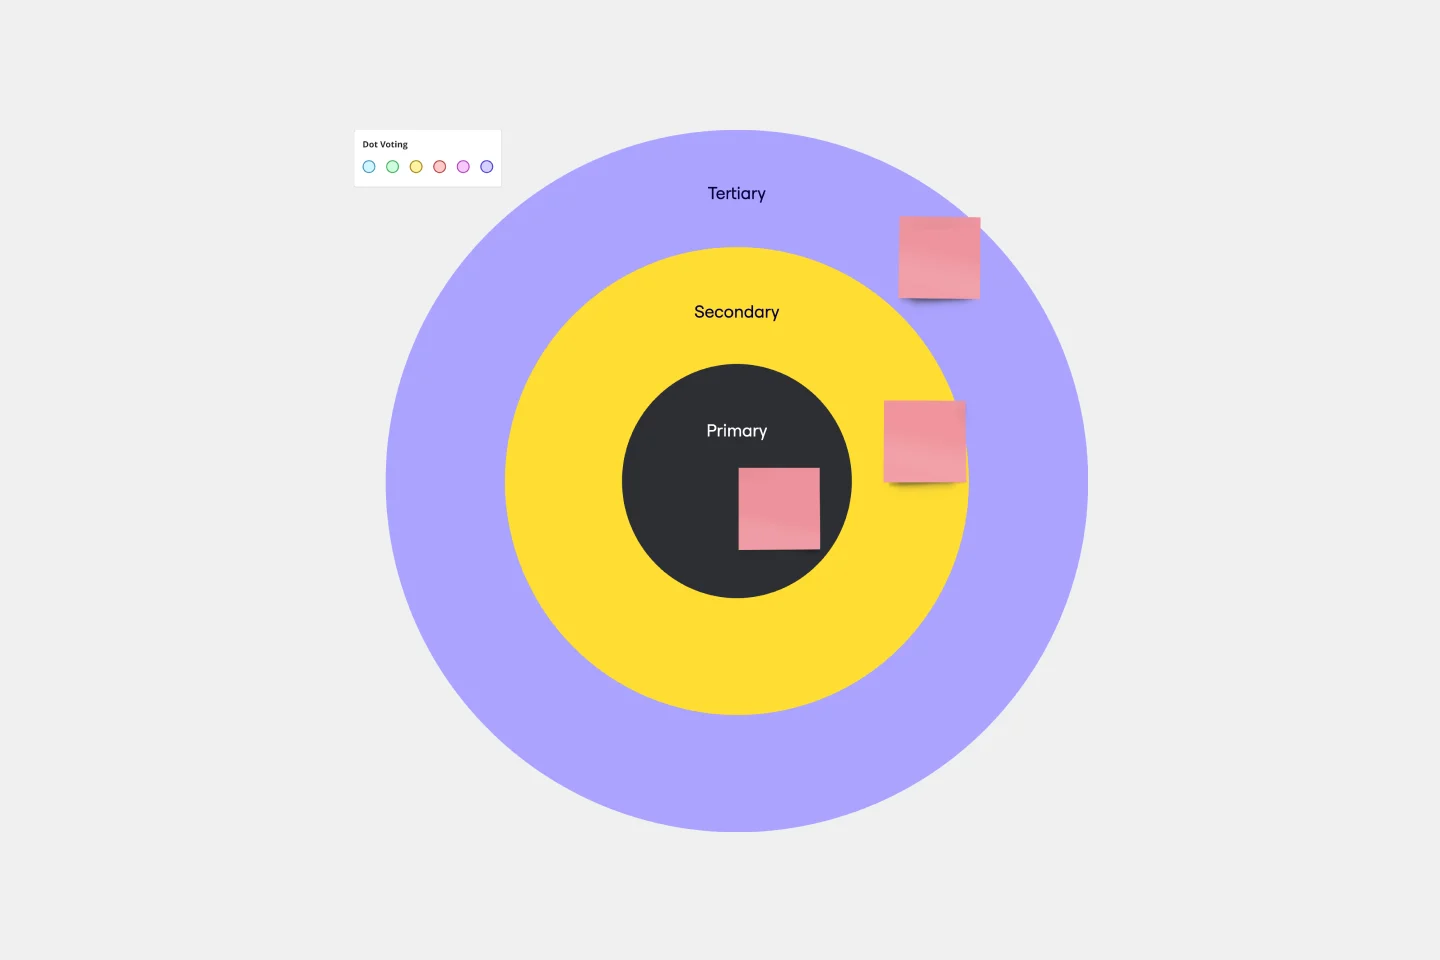
Bull's Eye Diagram Template
Works best for:
Diagrams, Project Management, Prioritization
When you’re a growing organization, every decision can feel like it has make-or-break consequences—which can lead to decision paralysis, an inability to prioritize, inefficient meetings, and even low morale. If that sounds like you, put a Bull’s Eye Diagram to work. True to its name, a Bull’s Eye Diagram uses a model of concentric circles to help companies establish priorities, make critical decisions, or discuss how to remove or overcome obstacles.
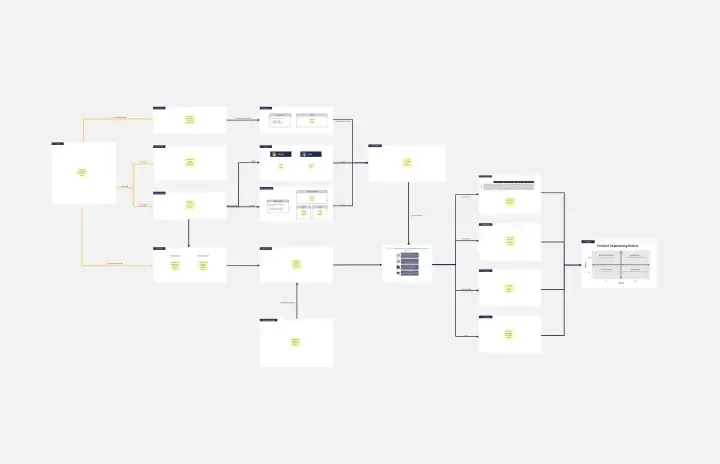
Product Management Onboarding Map
Works best for:
Product Management, Planning
Product Management Onboarding Map template facilitates the onboarding of new product management team members. By outlining key responsibilities, processes, and stakeholder interactions, this template helps new hires quickly acclimate to their roles. With sections for setting learning objectives and resources, it supports structured onboarding experiences, ensuring that new team members are equipped with the knowledge and tools needed to contribute effectively to product initiatives.