SIPOC Template
Identify all the relevant elements of a process improvement plan. Use the SIPOC template to document the working process from beginning to end.
About the SIPOC Diagram Template
The SIPOC model brings transparency and alignment to a process. This template offers a quick, convenient way to create a SIPOC diagram with minimal fuss. Use this visual tool to document the inputs and outputs of a process and share the final product with the rest of your team.
What is a SIPOC diagram?
A SIPOC diagram enables you to summarize the inputs and outputs of a process in the form of a customized table. This allows teams to identify relevant aspects of a process improvement project before starting work. SIPOC is useful when defining a complicated project that isn't necessarily well-scoped.
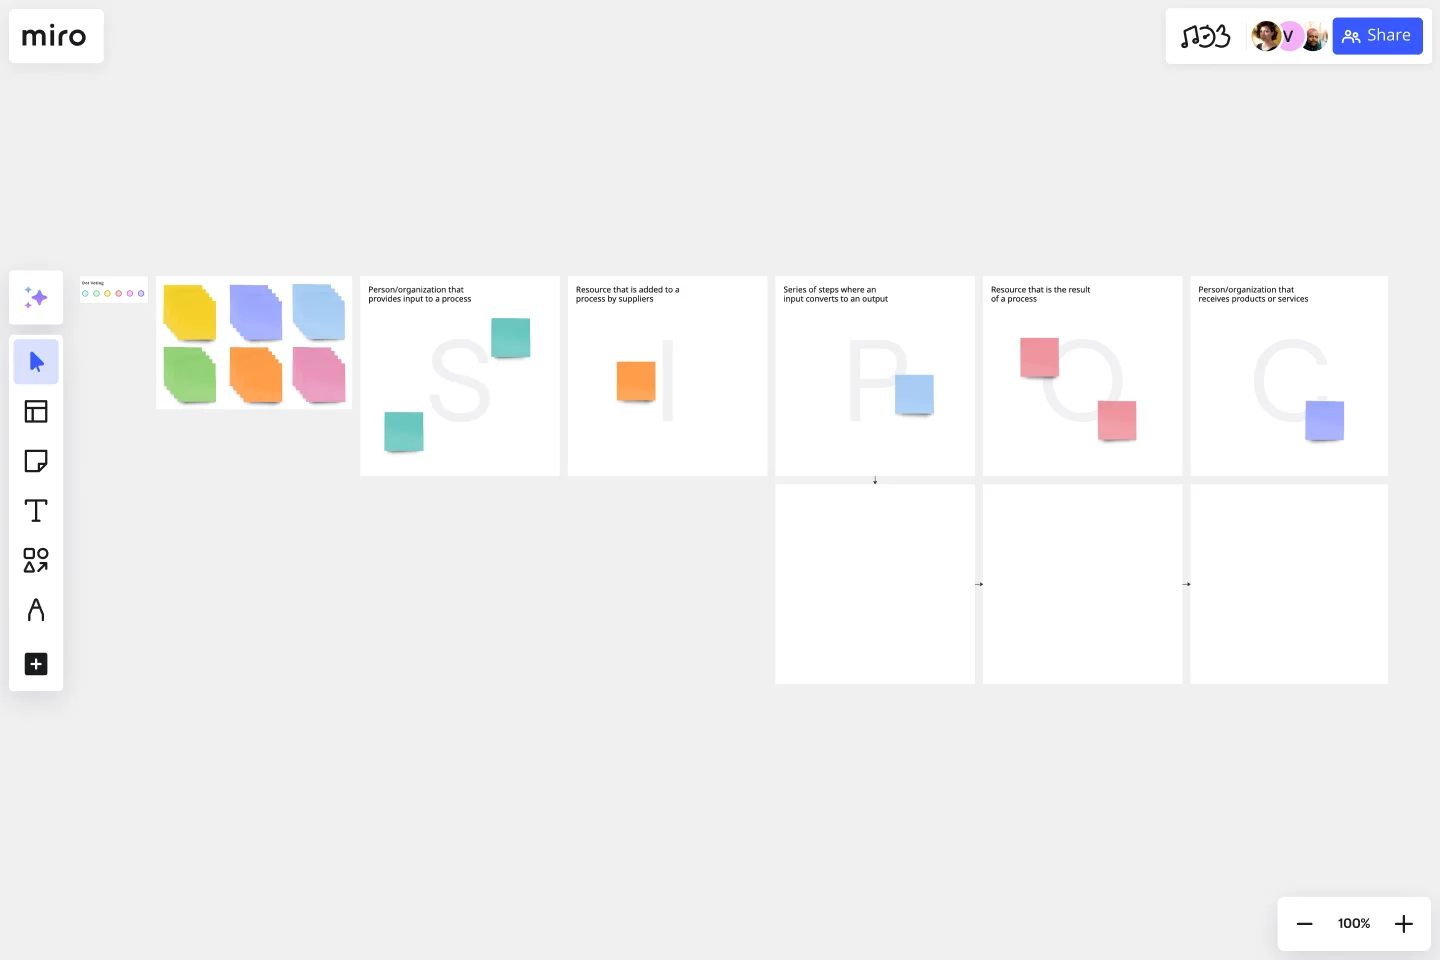
SIPOC is an acronym for Suppliers, Inputs, Process, Outputs, and Customers. The name invites the team to think about the suppliers of your process, the inputs to the process, the process itself, the outputs that you produce, and the customers who receive those outputs.
A SIPOC diagram can help you answer questions like:
Who supplies inputs to this process?
Who are the customers?
What are their needs?
What specifications are placed on inputs?
How to use the SIPOC diagram template in Miro
Here’s a step-by-step walkthrough of how to use the SIPOC diagram template to create your own diagram:
The SIPOC diagram template has the following sections under each letter:
S for suppliers
I for inputs
P for process
O for outputs
C for customers
Add the relevant information under each section with sticky notes, text, or any other artifact you see fit.
The Process section is organized so you can map a process chain, allowing information to be quickly and easily entered. Since the idea is to identify each step in a process from start to finish, others can add steps in an automatically growing chain.
Once the first step is identified, the blue circle can be clicked to automatically add another step in the process. This can be repeated until all steps of the process have been entered. The process will then be displayed in an easily understood visual format.
Benefits of using a SIPOC diagram template
Here’s how your team can benefit from using the SIPOC template:
Visual planning: A SIPOC diagram is a great tool for bringing a process into focus before any actions are taken. It offers an excellent preproduction stage that allows issues to be ironed out in advance.
Streamline processes: A SIPOC diagram can act as an improvement tool for processes or projects that have already been completed. Even if the process or workflow was a success, the diagram still provides an easy way to find areas for improvement.
Enhanced communication: Project teams and individuals are made aware of all aspects of the project or process in an easily understood and quickly digested visual tool format. The SIPOC template provides a full perspective for your team on a single page.
Better collaboration: The tool helps your team identify all persons or organizations providing input into a process. This helps everyone understand what input they are providing and how that input relates to all other aspects of the process.
Customer-centric: Customer requirements aren't only identified, but specific expectations are also highlighted. Therefore, all parties involved can appreciate the ultimate goal of the process and aim toward it more efficiently.
What is SIPOC used for?
The SIPOC Diagram is used to plot out the various steps of a process. It includes everyone involved in the process, as well as specific customer requirements. The diagram can serve either to effectively visualize a process before it is acted on or to improve a process that's already in effect. It isn't necessary to include detailed steps when creating a diagram but rather to identify all persons and parties involved.
What do I do after SIPOC?
Depending on what the SIPOC Diagram is used for, the steps that follow will differ. If the diagram was used to plan a process, the next step would be implementation. This would include contacting relevant parties, informing them of the strategy, and moving forward into action. It’s a good idea to provide all parties with the finished SIPOC Diagram for reference. If the SIPOC Diagram was used to improve an existing process, the next steps would be to inform all parties involved of any inefficiencies or problems uncovered and agree steps to tackle them. Again, providing the diagram would be necessary.
What is the difference between SIPOC and a process map?
A SIPOC diagram is different from a process map, otherwise called a flow chart, in several ways. Essentially, a process map is a simplified version of a SIPOC diagram, identifying only the steps involved in a process. A SIPOC Diagram aims to identify the process and the parties involved in each step.
Can I collaborate with others using a SIPOC diagram template?
Yes, collaboration is often encouraged when creating a SIPOC diagram. Input from various team members and stakeholders can provide a more comprehensive understanding of the process.
Can a SIPOC diagram be used in various industries?
Yes, SIPOC diagrams are versatile and can be applied across different industries, including manufacturing, services, healthcare, and more.
Get started with this template right now.
Prune the Product Tree Template
Works best for:
Design, Desk Research, Product Management
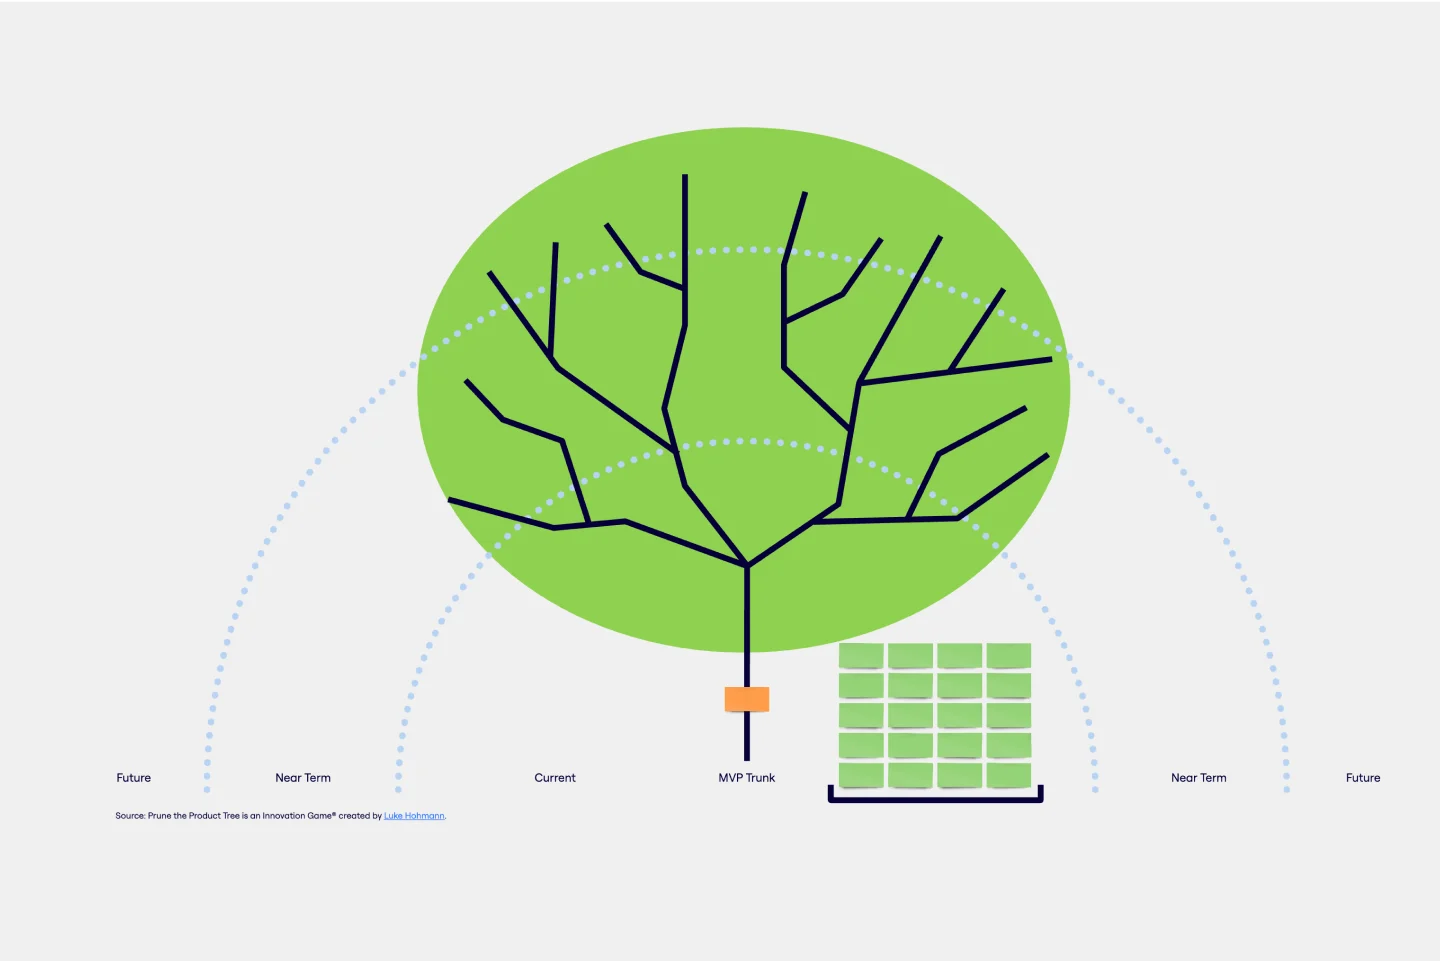
Prune the Product Tree (also known as the product tree game or the product tree prioritization framework) is a visual tool that helps product managers organize and prioritize product feature requests. The tree represents a product roadmap and helps your team think about how to grow and shape your product or service by gamifying feedback-gathering from customers and stakeholders. A typical product tree has four symbolic features: the trunk, which represents the existing product features your team is building; the branches, each of which represents a product or system function; roots, which are technical requirements or infrastructure; and leaves, which are new ideas for product features.
CI/CD Pipeline Diagram Template
Works best for:
Diagramming, Development
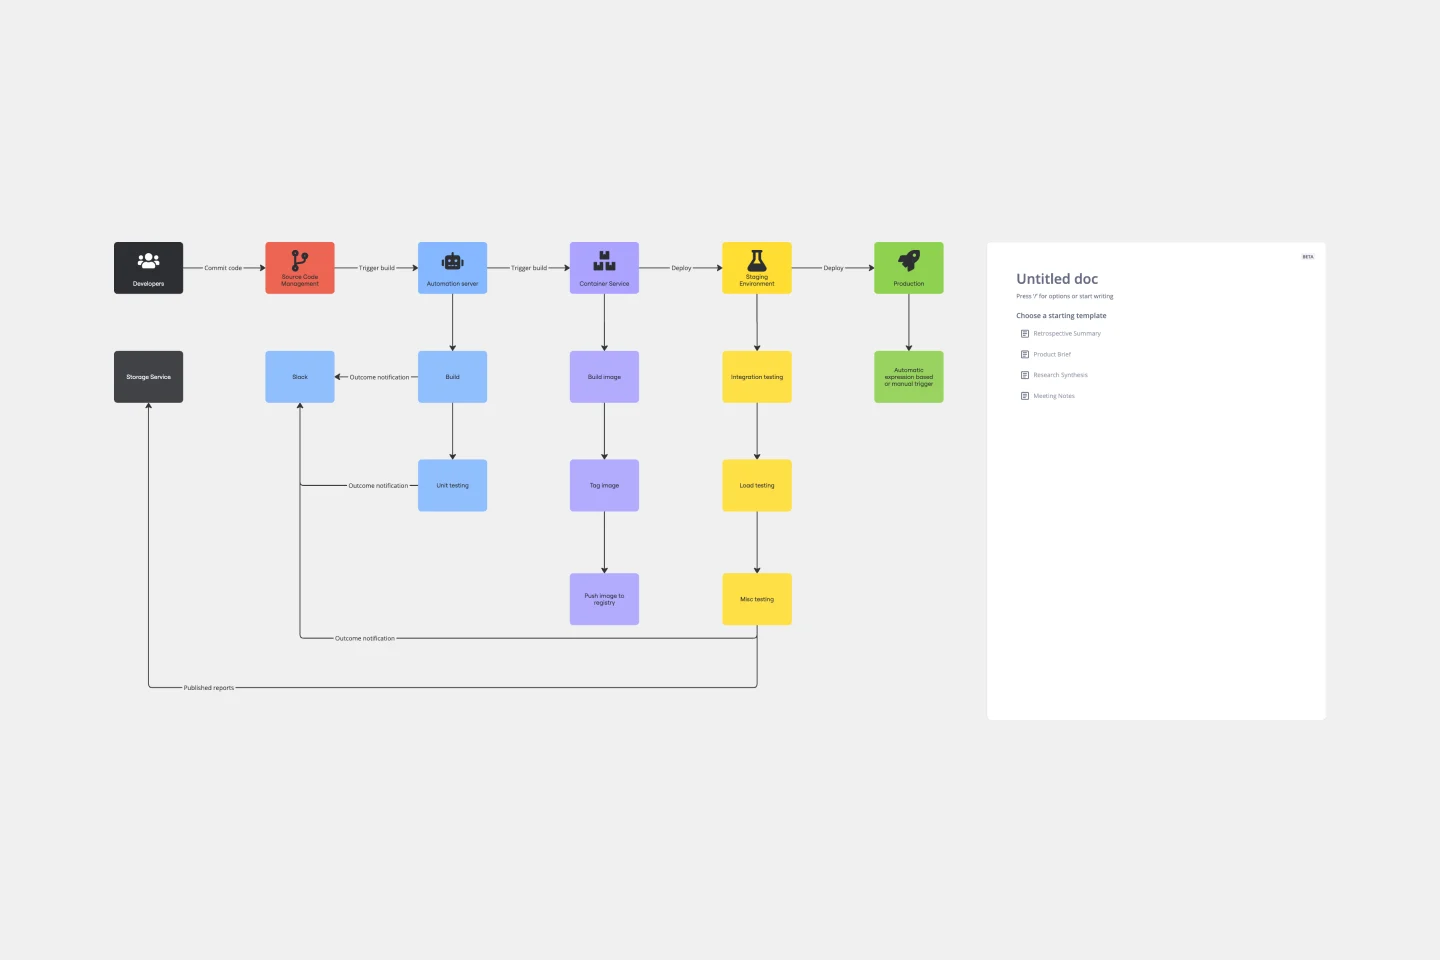
The CI/CD template is a well-designed roadmap for software deployment that enables a smooth and automated flow from development to production. This strategic layout includes critical elements such as source code management, automation servers, container orchestration, staging environments, and the final deployment to production. One of the key benefits of using such a template is that it builds a robust deployment pipeline, which significantly reduces manual intervention and human error. By visualizing each step and integrating automation throughout, teams can achieve faster deployment cycles, ensuring that new features, updates, and fixes are delivered to users promptly and reliably. This enhanced pace does not compromise quality, as the template inherently supports continuous testing and quality assurance, ensuring that each update is quick but also secure and stable before it is delivered to the end user.
UML Diagram Template
Works best for:
Diagrams, Software Development
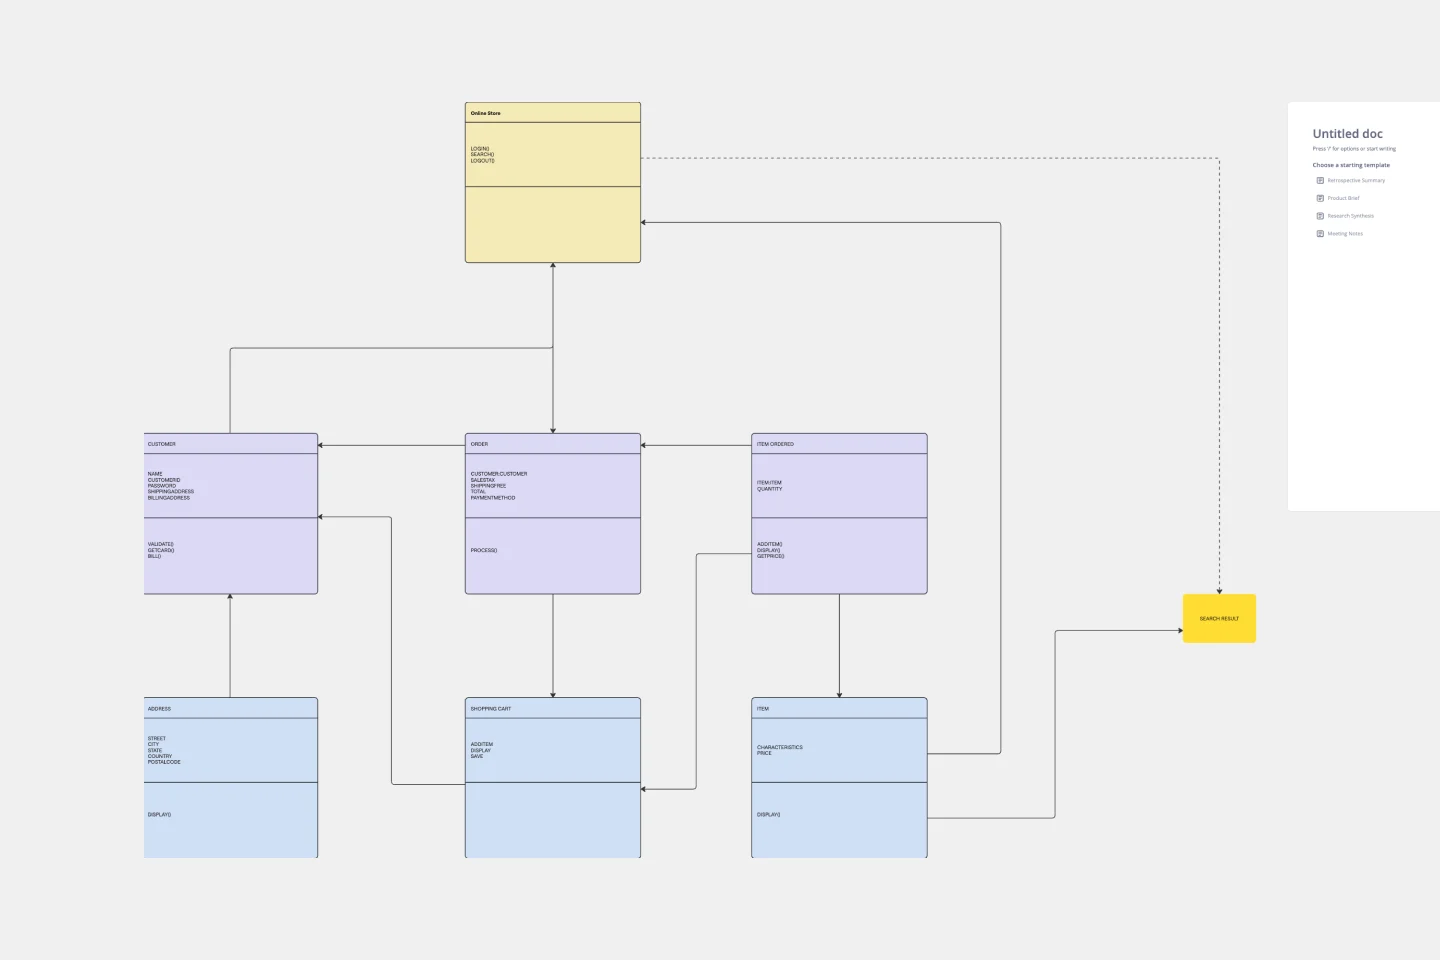
Originally used as a modeling language in software engineering, UML has become a popular approach to application structures and documenting software. UML stands for Unified Modeling Language, and you can use it to model business processes and workflows. Like flowcharts, UML diagrams can provide your organization with a standardized method of mapping out step-by-step processes. They allow your team to easily view the relationships between systems and tasks. UML diagrams are an effective tool that can help you bring new employees up to speed, create documentation, organize your workplace and team, and streamline your projects.
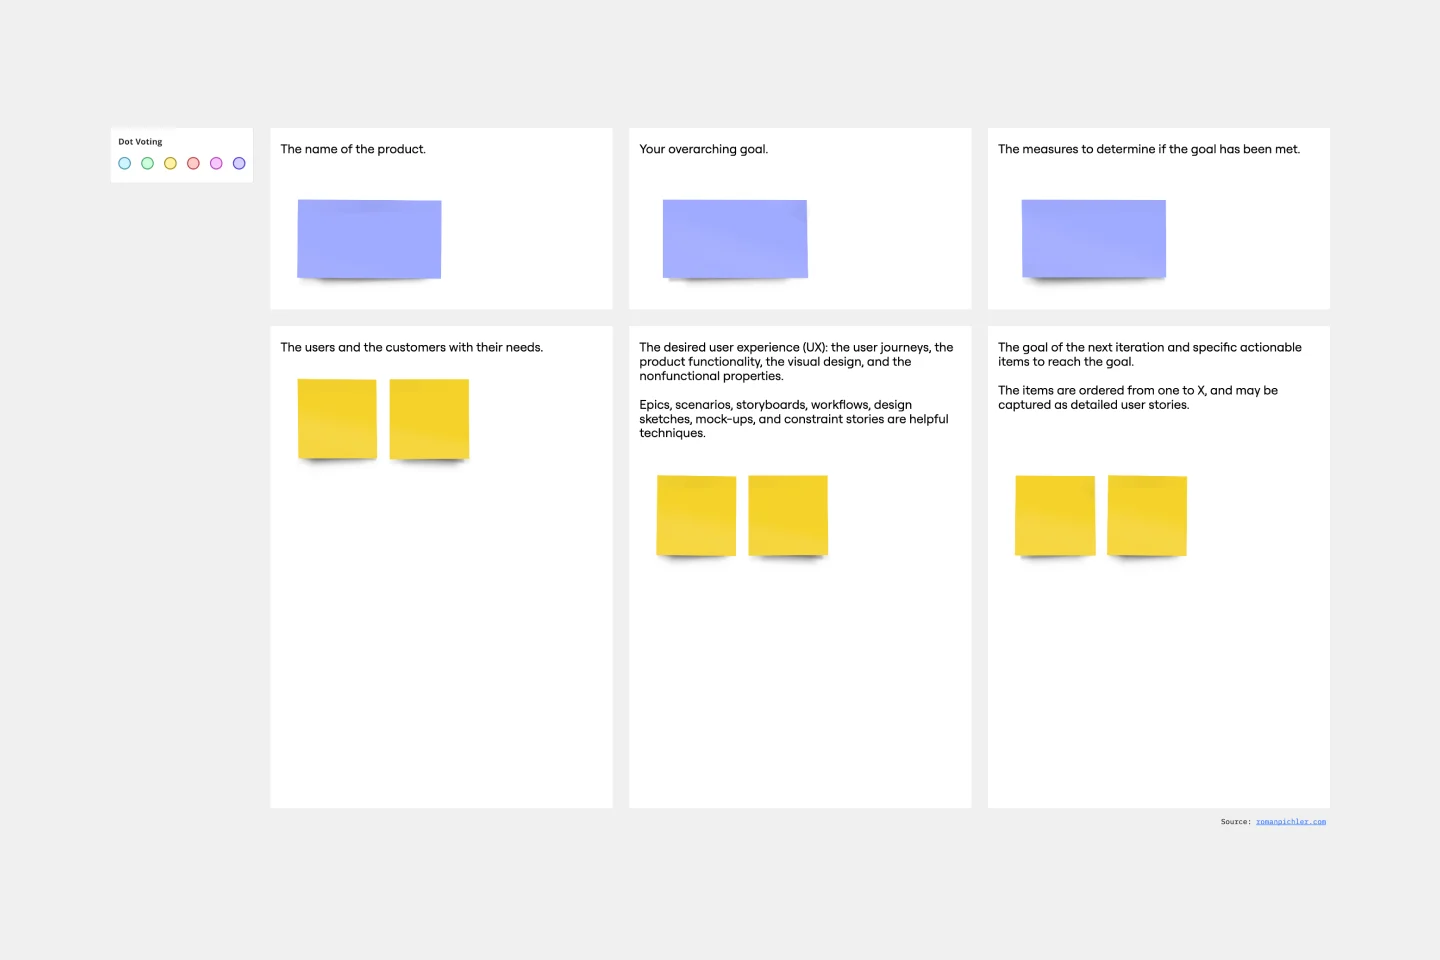
Product Canvas Template
Works best for:
Desk Research, UX Design
Product canvases are a concise yet content-rich tool that conveys what your product is and how it is strategically positioned. Combining Agile and UX, a project canvas complements user stories with personas, storyboards, scenarios, design sketches, and other UX artefacts. Product canvases are useful because they help product managers define a prototype. Creating a product canvas is an important first step in deciding who potential users may be, the problem to be solved, basic product functionality, advanced functionalities worth exploring, competitive advantage, and customers’ potential gain from the product.
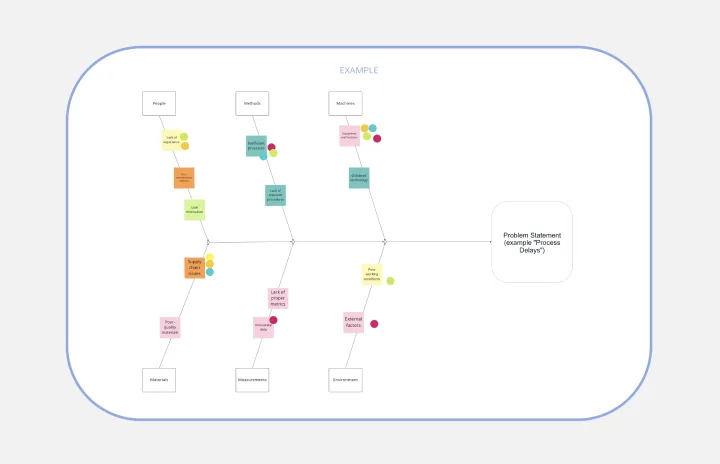
Fishbone Diagram for Process Improvement
Works best for:
Planning, Strategy
Process improvement is key to enhancing efficiency and productivity. The Fishbone Diagram for Process Improvement template helps you identify the root causes of process inefficiencies. Categorize potential causes into areas such as workflow, resources, technology, and personnel. This structured analysis enables your team to systematically explore and address issues, streamlining processes and boosting overall productivity.
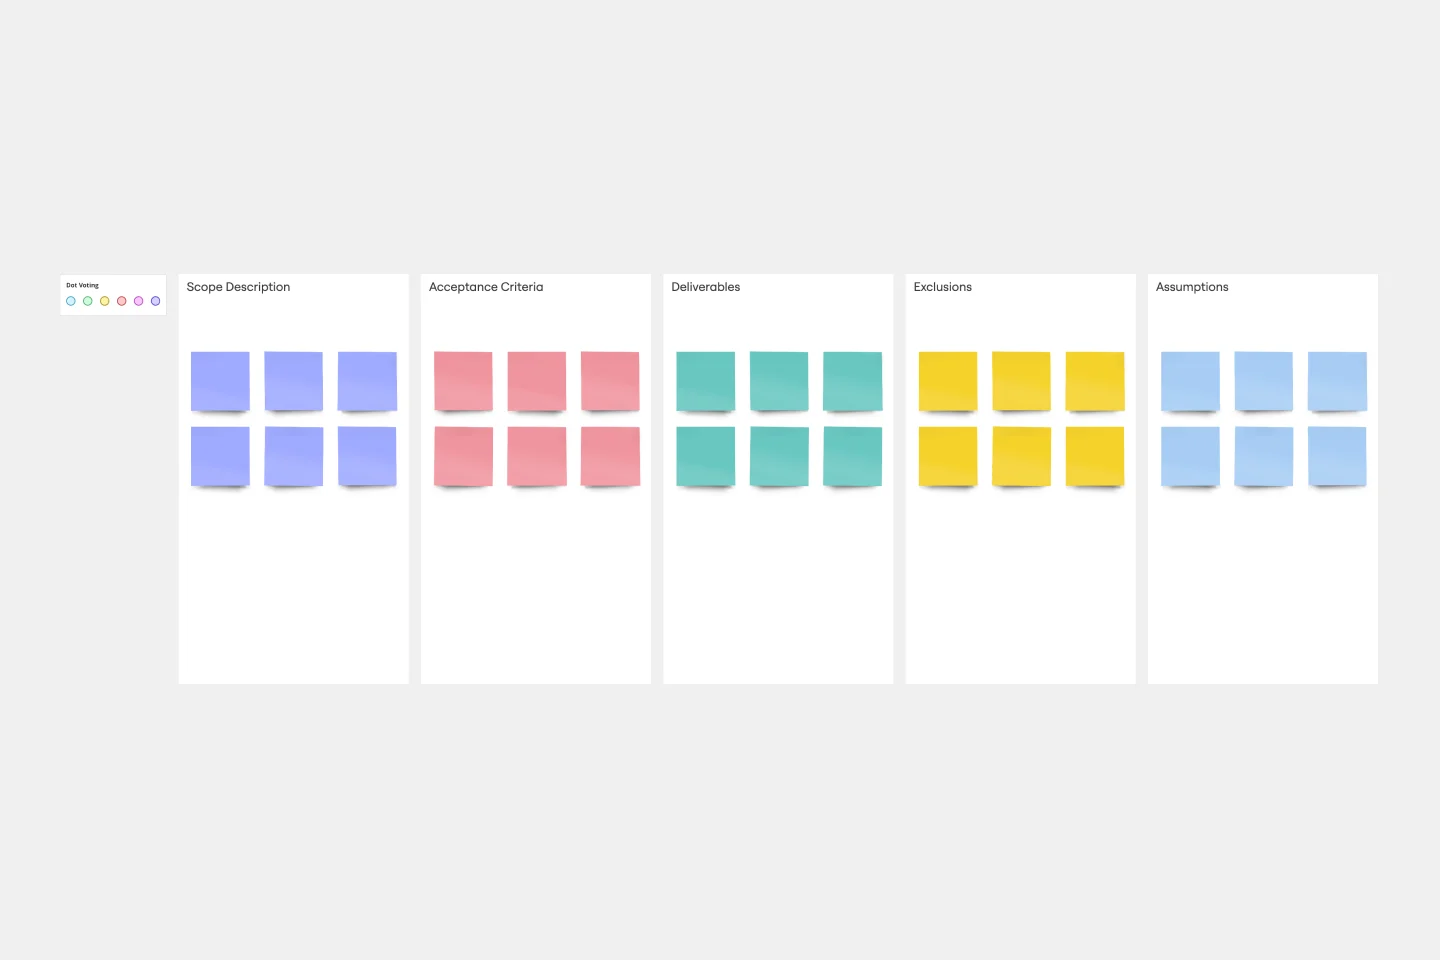
Project Scope Template
Works best for:
Project Management, Decision Making, Project Planning
A project scope helps you plan and confirm your project’s goals, deliverables, features, functions, tasks, costs, and deadlines. A project manager and team should develop a project scope as early as possible, as it will directly influence both the schedule and cost of a project as it progresses. Though project scopes will vary depending on your team and objectives, they generally include goals, requirements, major deliverables, assumptions, and constraints. Aim to include the whole team when you create a project scope to ensure everyone is aligned on responsibilities and deadlines.