Task Analysis Diagram Template
Analyze your user path by mapping out their tasks in a systematic way with the task analysis diagram template.
About the Task Analysis Diagram Template
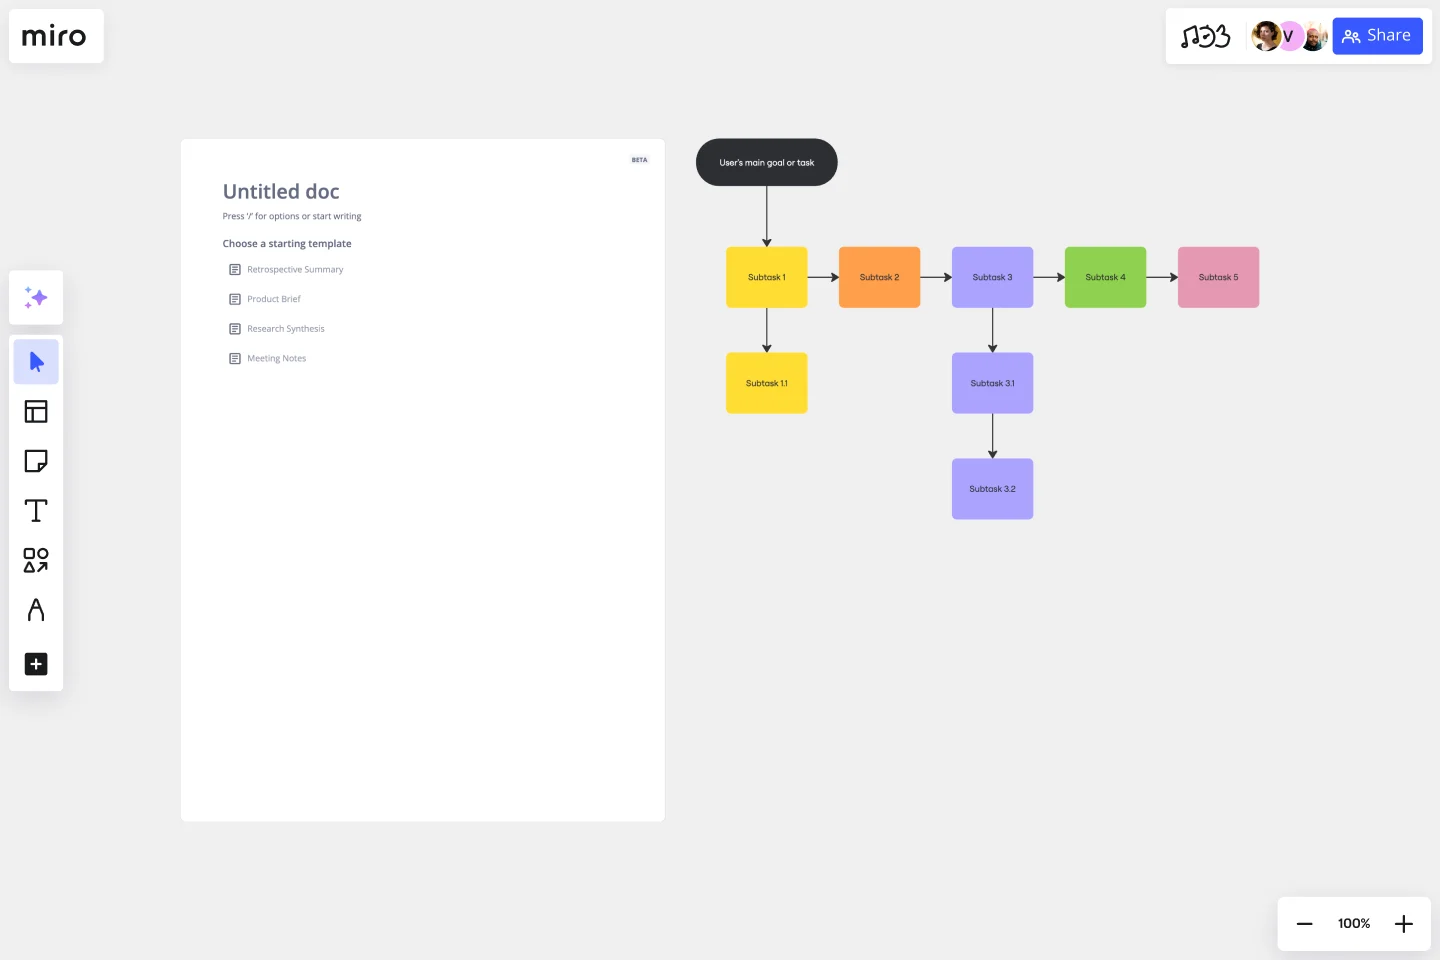
The task analysis diagram template is a visual tool that helps capture, organize, and categorize a user's tasks while interacting with a product. It is designed to break down user tasks and their interactions, making it easier to bridge the gap between planning and action. This template is perfect for anyone wanting to unravel a process's complexities and turn them into actionable steps.
The template presents each task in a sequential and hierarchical order, which makes it easier to understand the flow of the user's journey and identify dependencies and potential issues. It is like creating a map of the user's journey, where each step and action is detailed, ensuring a clear understanding of the entire process.
How do you use the task analysis diagram template?
Follow these four simple steps to get started:
Edit the template: Change the template to suit your needs with just a few clicks. You can add tasks, delete redundancies, or change the flow of the diagram. The template is designed to be user-friendly and easy to edit.
Expand: Need to expand the diagram? Miro’s automated diagramming features let you quickly add more shapes and connector lines while maintaining the diagram's structure.
Add contextual information: Make your diagram more comprehensive by adding relevant artifacts, such as documents, links, or images, for additional information.
Why should you use the task analysis diagram template?
Clear visualization: The template provides a clear, concise, and visual representation of all tasks and their interactions, making it easier to understand and follow than textual explanations.
Process identification: Using the template helps identify redundant tasks, potential bottlenecks, or gaps that might have been overlooked, which can be addressed to improve the overall process.
Enhanced collaboration: Team members can collaboratively view, discuss, and edit the diagram, ensuring everyone is on the same page and making it easier to work together.
User-centric design: Understanding the tasks a user undergoes helps design or change products to better suit user needs and preferences, resulting in better user experiences.
Structured approach: The template gives a structured approach to task analysis, ensuring no task or detail is overlooked and making the process more organized and efficient.
If you'd prefer to start from scratch, diagramming with Miro is easy! You can choose from a wide range of diagramming shapes in Miro's extensive library, so you'll find just what you need.
What if I need to add more tasks than the template provides?
No worries! The template is expandable. You can effortlessly add more shapes and connectors to accommodate additional tasks.
Can multiple team members collaborate on the same diagram?
Absolutely. The template is designed for collaborative efforts, ensuring multiple people can view, comment, or edit in real time.
Is there a way to integrate other information or links directly into the diagram?
Yes, you can seamlessly add any artifact onto the board, be it a document, image, or hyperlink, to provide richer context and information.
Get started with this template right now.
Datavant Switchboard with AWS Clean Rooms Template
Works best for:
AWS
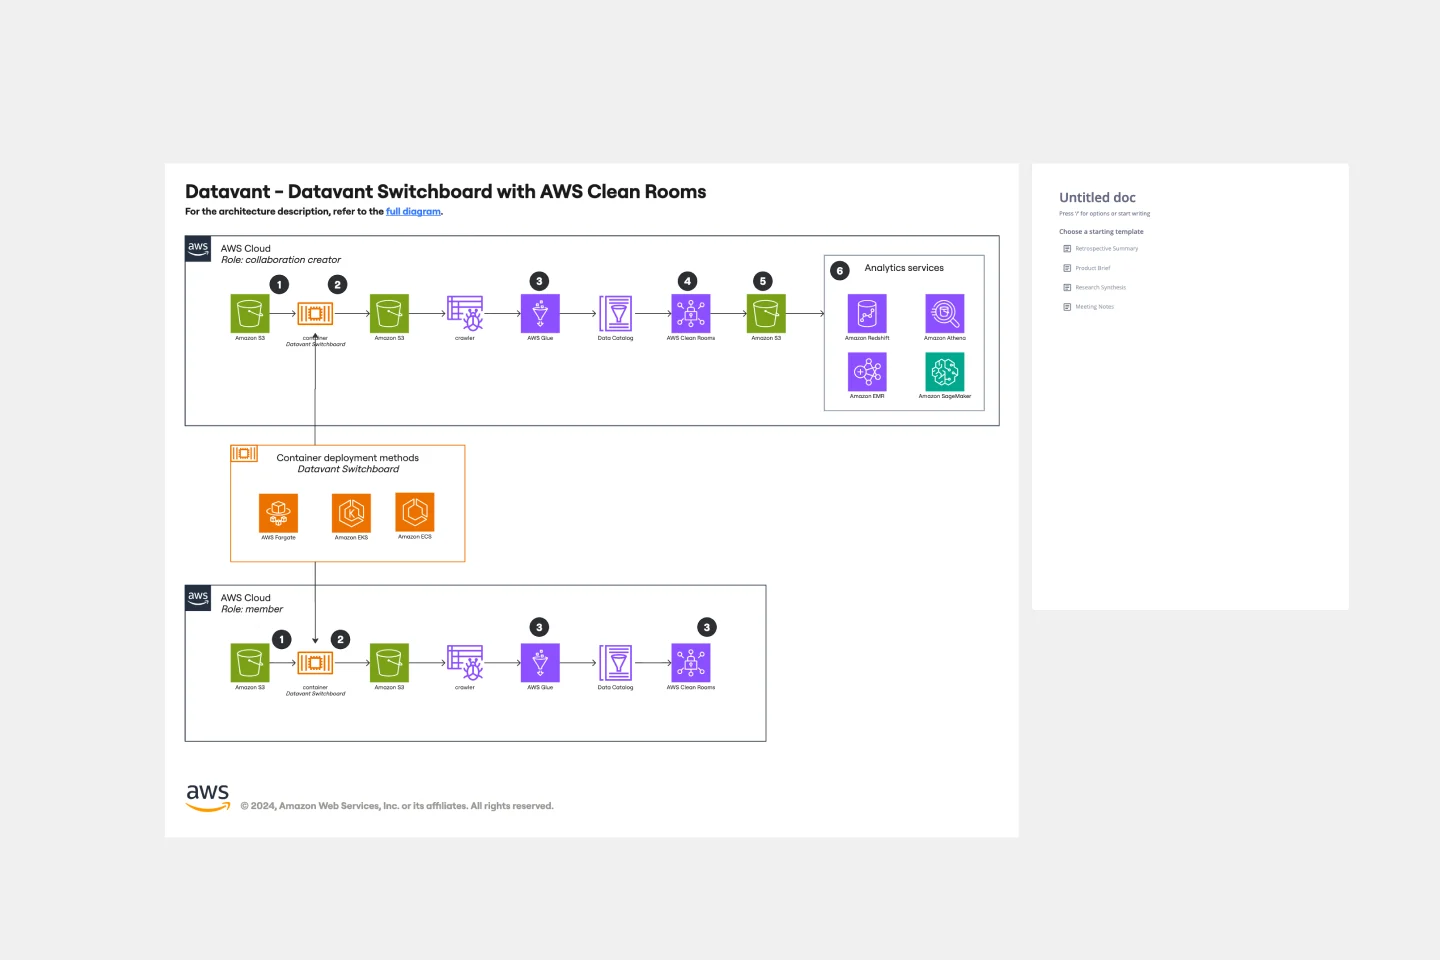
The AWS Datavant Switchboard Clean Rooms Template integrates health data sources using Datavant's secure data connection capabilities and AWS Clean Rooms' scalable data processing environment. It's useful for professionals in engineering, database management, and development. The customizable Miro interface streamlines secure and efficient data handling and team collaboration for a wide range of projects.
Cloudflare RAG Architecture Knowledge Queries Template
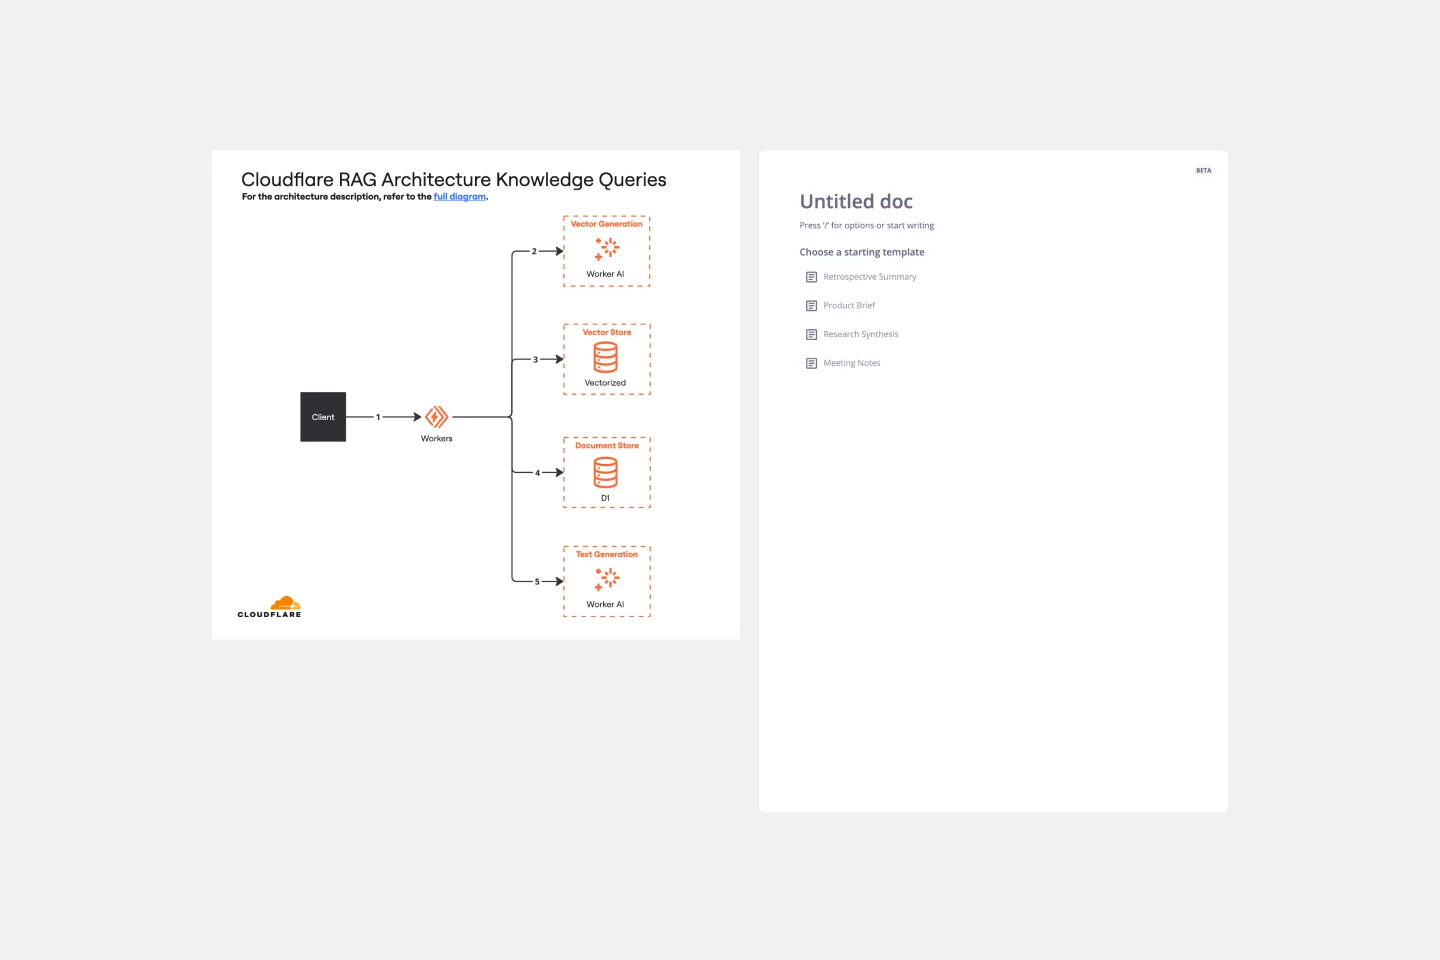
The Cloudflare RAG Architecture Knowledge Queries template is a cutting-edge tool designed to streamline the process of diagramming and understanding the intricate architecture of Cloudflare's Retrieval Augmented Generation (RAG) system. This template is a boon for teams aiming to visualize, query, and optimize Cloudflare's infrastructure collaboratively.
Serverless Image Handler on AWS Template
Works best for:
AWS
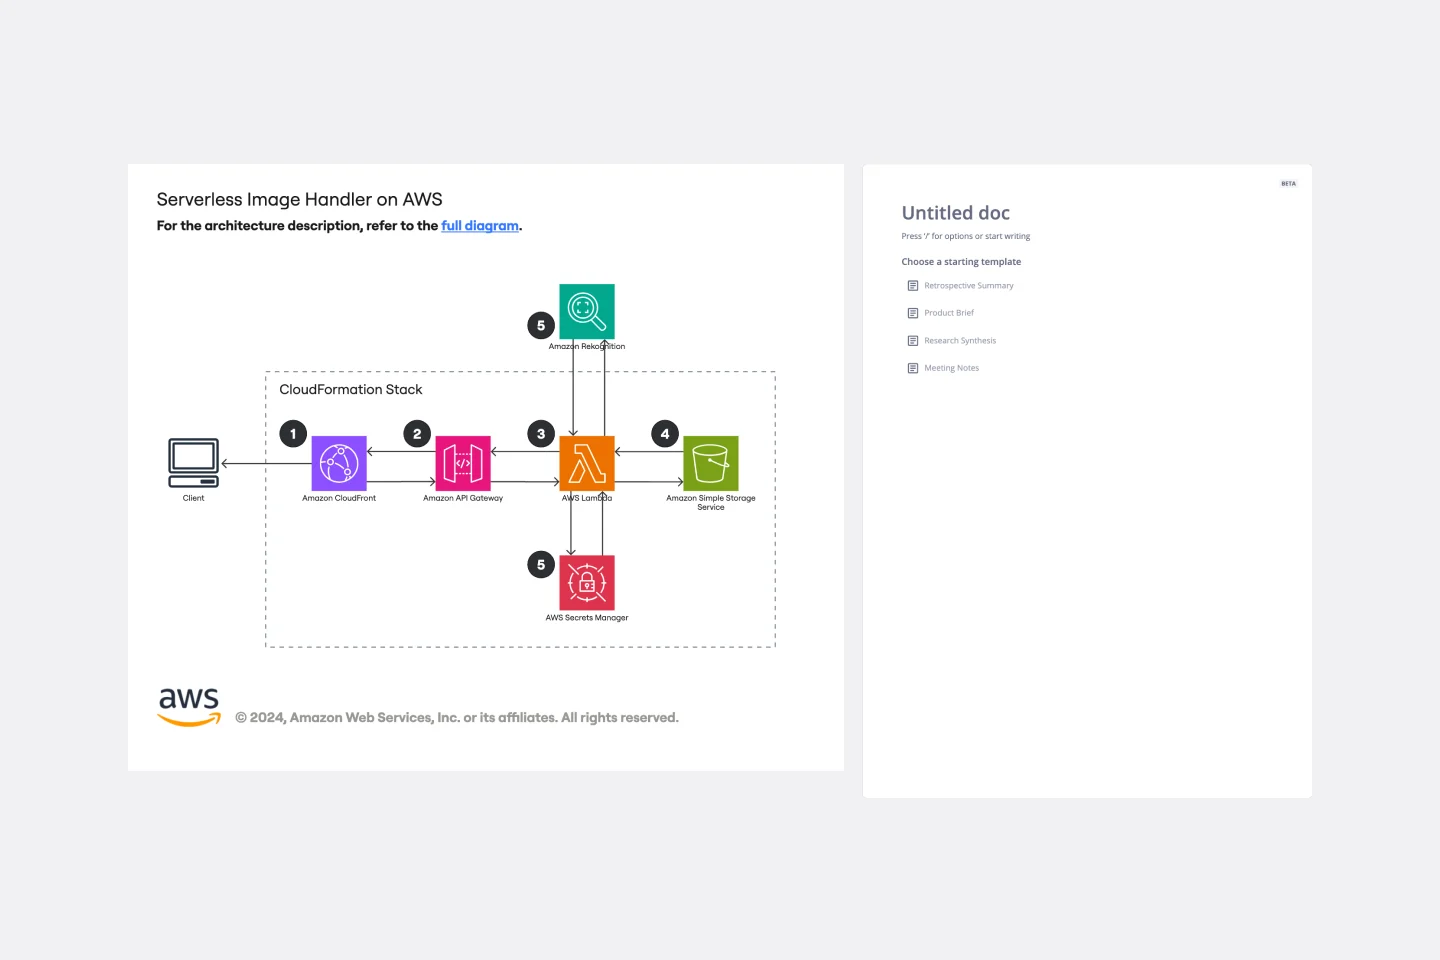
The Serverless Image Handler on AWS template is designed to facilitate the management and transformation of images in cloud-based projects without the need for server infrastructure management. It is particularly useful for applications and projects that require dynamic image management, offering benefits like efficiency, scalability, and seamless integration with AWS services. By incorporating this template into Miro boards or projects, teams can streamline their workflows, especially when dealing with digital assets or dynamic content, ensuring that their image-handling needs are met efficiently as they scale.
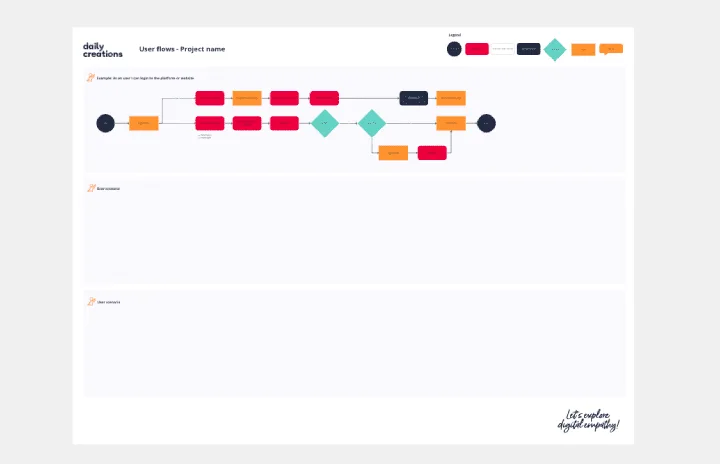
User Flows
The User Flows template offers a visual tool for mapping out the sequence of steps that users take to accomplish a specific task or achieve a goal within a digital product or service. It provides elements for documenting user interactions, screens, and decision points along the user journey. This template enables UX designers and product teams to understand user behaviors, identify pain points, and optimize the user experience effectively. By promoting user-centric design and empathy, the User Flows template empowers teams to create intuitive and engaging digital experiences that meet user needs and drive satisfaction.
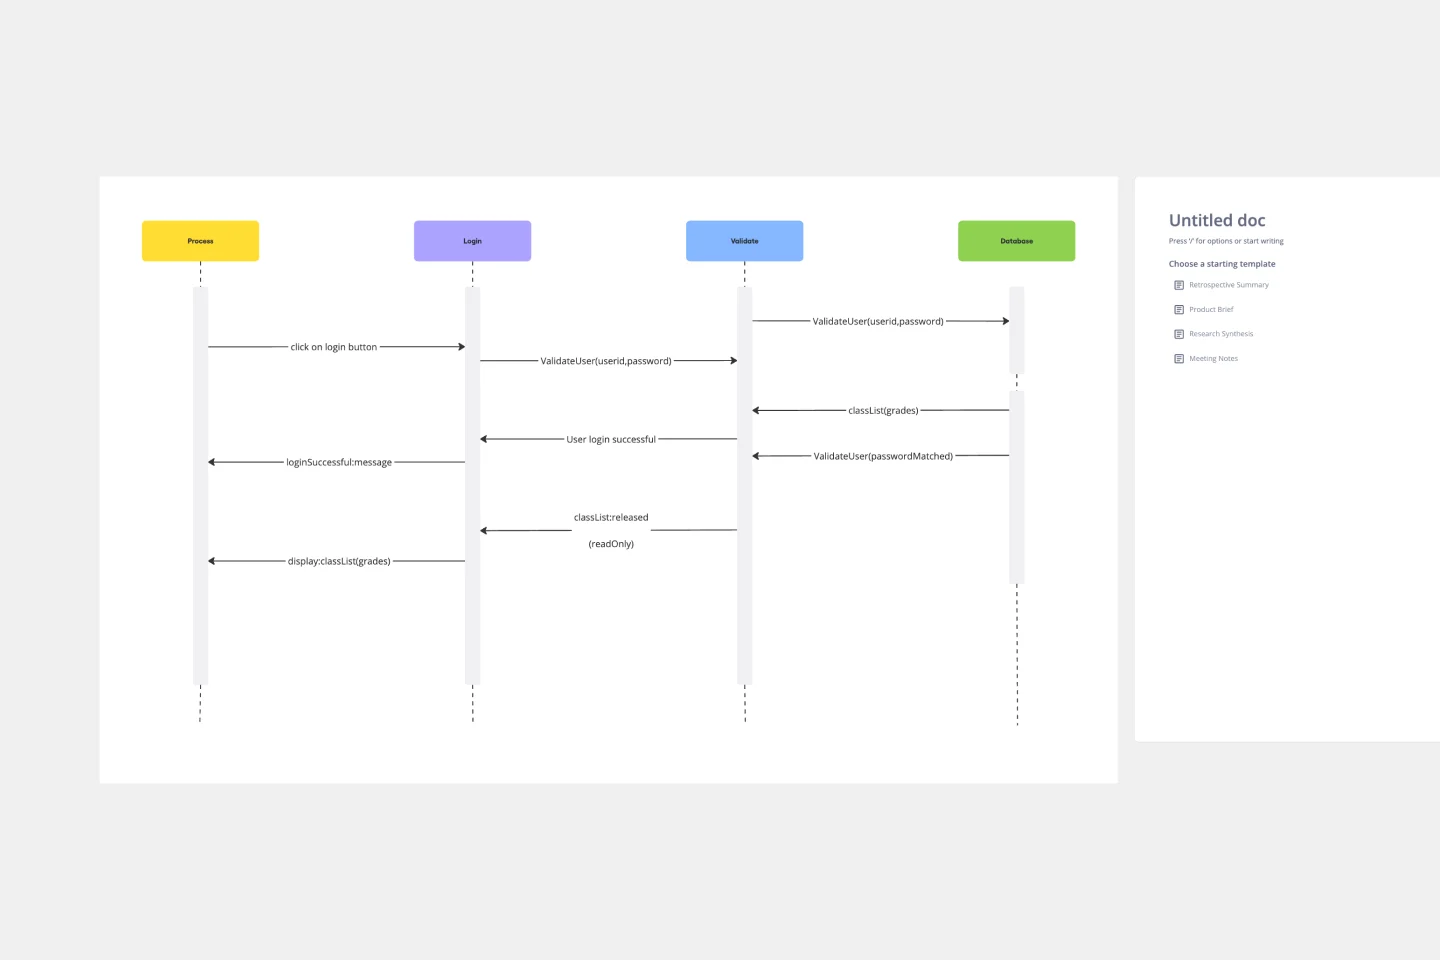
Login Sequence Diagram Template
Works best for:
Diagramming, Technical Diagramming
The UML Sequence Login Diagram Template is a valuable tool for visualizing user authentication processes. It breaks down complex login sequences into clear, visual components, facilitating collaborative understanding among team members, regardless of their technical expertise. This shared understanding is crucial for ensuring all stakeholders, from developers to project managers, are on the same page, leading to efficient decision-making and a smoother development process. The template's ability to translate technical details into an accessible format streamlines communication and significantly reduces the likelihood of misinterpretation or oversight, making it an essential asset in any software development project.
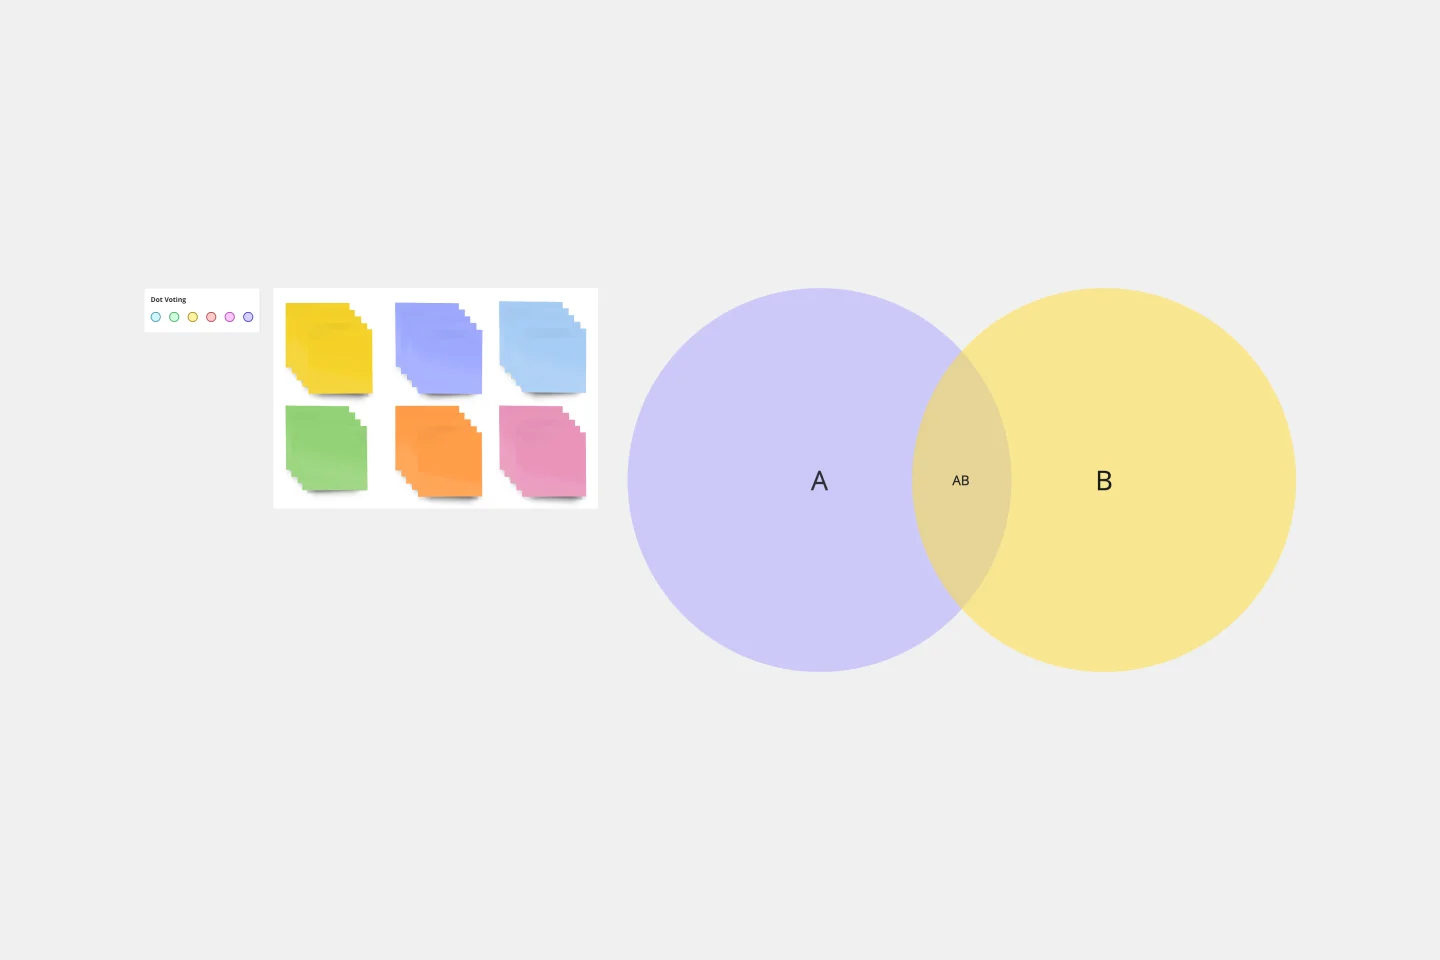
2-Circle Venn Diagram Template
The 2 Circle Venn Diagram Template is a dynamic, intuitive tool designed to represent the logical relationships between two data sets visually. For teams, this template proves valuable in enabling efficient collaboration, clear communication, and shared understanding.