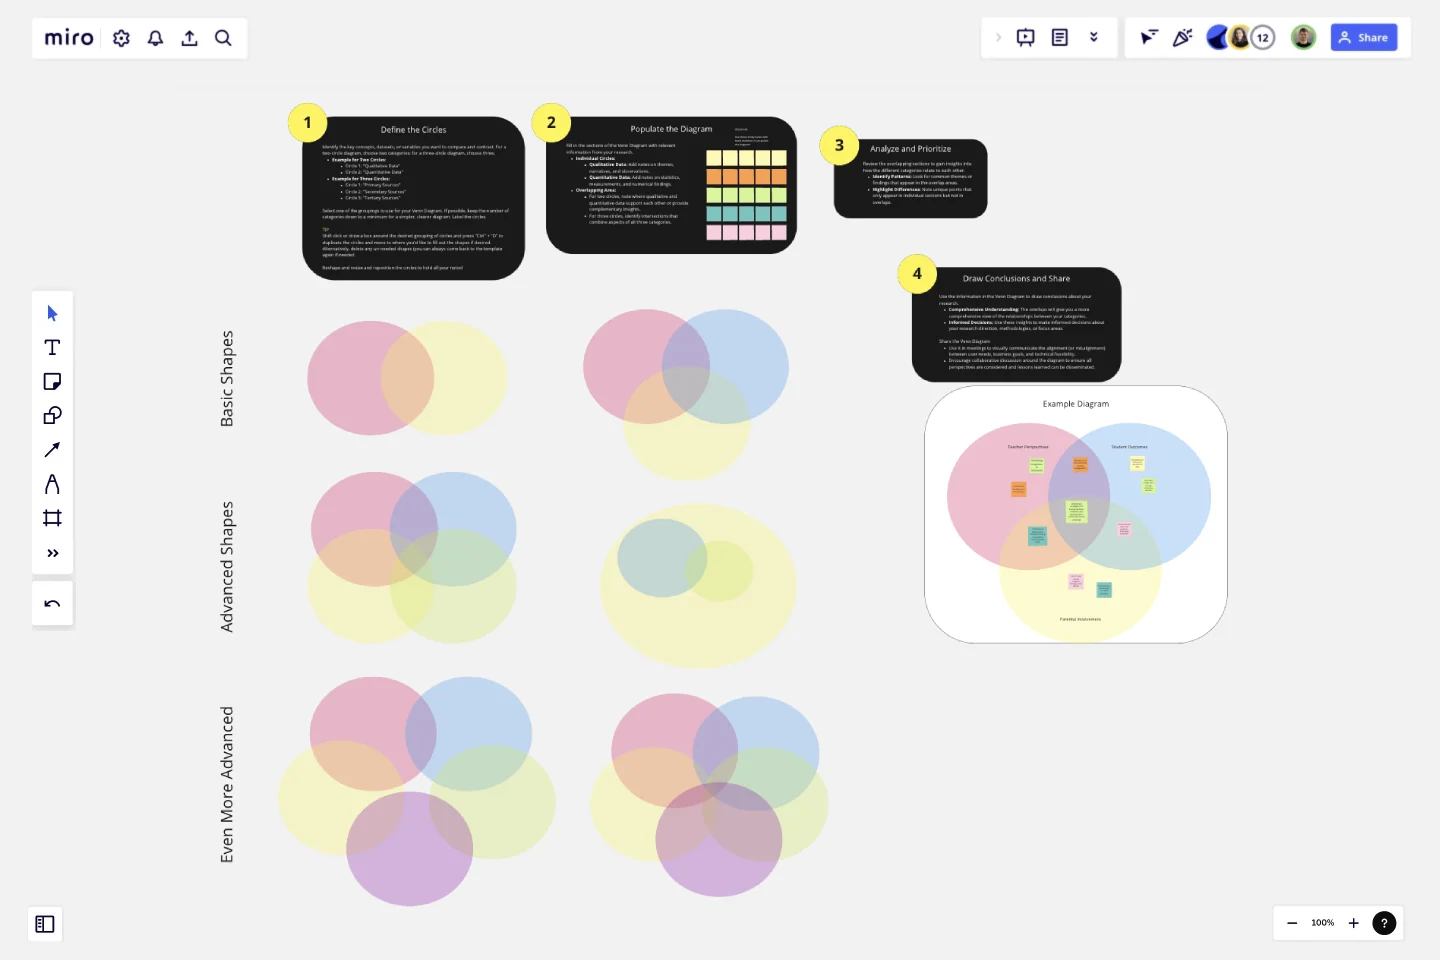
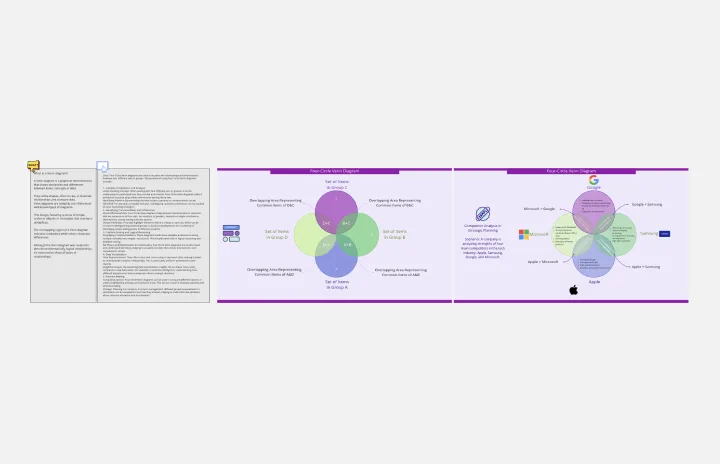
Venn Diagram for Research
The Venn Diagram for Research template is an essential tool designed to help researchers visually organize, compare, and contrast different datasets, concepts, or variables.
By clearly displaying the relationships and overlaps between categories, this template aids in uncovering insights and drawing meaningful conclusions.
Why Use This Template?
Organize Complex Data:
Visual Clarity: The template simplifies the organization of complex data, making it easier to understand and analyze.
Structured Comparison: Helps in systematically comparing and contrasting different research elements.
Enhance Analytical Insights:
Identify Patterns: Easily spot patterns, trends, and relationships between different datasets or variables.
Highlight Gaps: Quickly identify gaps or areas needing further investigation.
Facilitate Collaboration:
Team Alignment: Use the template in collaborative research settings to ensure all team members have a clear understanding of the relationships between different research elements.
Interactive Discussions: Ideal for group discussions, brainstorming sessions, and collaborative analysis.
Support Decision-Making:
Informed Conclusions: Helps in making informed decisions by clearly showing the intersection of different research categories.
Strategic Planning: Assists in planning research focus areas, methodologies, and further investigations.
Ease of Use:
Pre-Defined Sections: Comes with pre-defined sections for various categories and their overlaps, making it quick and easy to start using.
Editable Placeholders: Includes editable placeholders for notes, allowing for customization based on specific research needs.
Versatile Application:
Adaptable: Suitable for various types of research, including qualitative, quantitative, and mixed-methods studies.
Reusable: Can be reused across different research projects, making it a valuable tool for ongoing research activities.
Use Cases:
Comparative Studies: Compare different datasets, such as qualitative and quantitative data, or different sources of information.
Thematic Analysis: Identify common themes and unique insights across various research categories.
Data Integration: Integrate findings from different studies or sources to draw comprehensive conclusions.
Research Planning: Plan and prioritize research activities based on identified overlaps and gaps.
Template Features:
Instructions Section:
Step-by-Step Guide: Simple instructions on how to fill out and use the Venn Diagram effectively.
Example Notes:
Pre-Populated Examples: Examples of notes for each section to help users understand how to populate the diagram.
By choosing the Venn Diagram for Research template, researchers can effectively organize and analyze their data, leading to deeper insights and more robust conclusions. This template is ideal for anyone looking to streamline their research process and enhance collaborative efforts.
This template was created by Anthony.
Get started with this template right now.
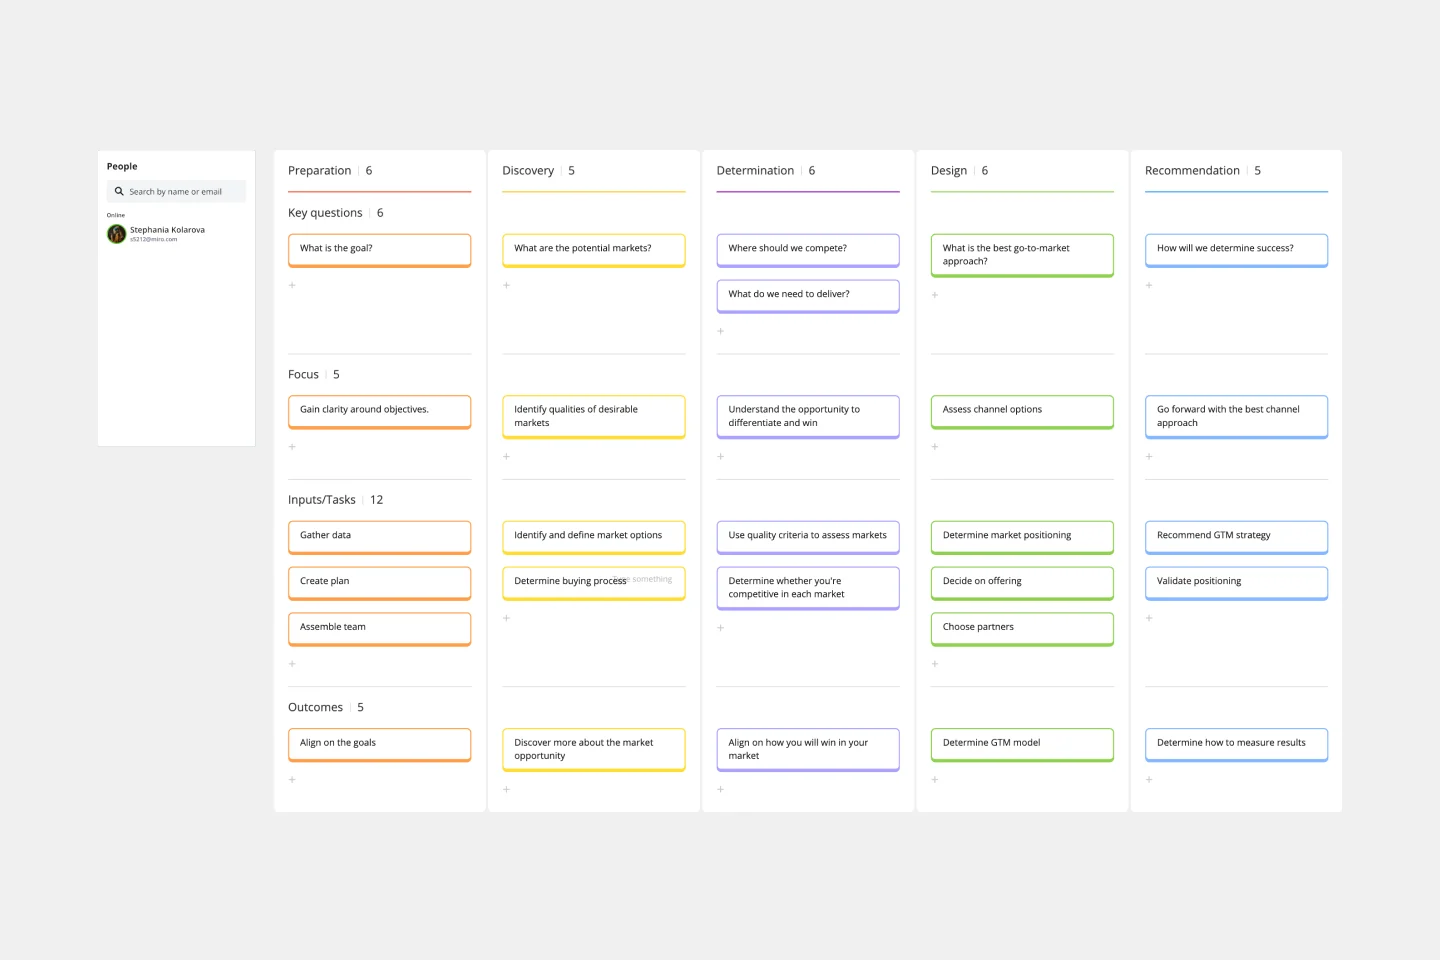
Go-to-Market Strategy Template
Works best for:
Marketing, Desk Research, Strategic Planning
It doesn’t matter how innovative or effective a new product is — if it doesn’t get noticed and adopted by the right audience, the product won’t get off the ground. That’s where your Go-to-Market Strategy comes in. It’s a single resource that houses all of your research, insights, and data, and includes your business plan, target audience, marketing approach, and sales strategy. A GTM is especially important for any startups who grow fast, have to make split-second decisions, and have to be fully in sync.
Mandala Chart Template
Works best for:
Planning, Brainstorming, Goal setting
The Mandala Chart Template helps you visualize the relationships between a central theme and its sub-themes. One of the key benefits is how it fosters a holistic understanding of any topic. This perspective ensures every detail is noticed, making it an invaluable asset for those aiming for comprehensive insight and thorough planning or a better understanding of their goals.
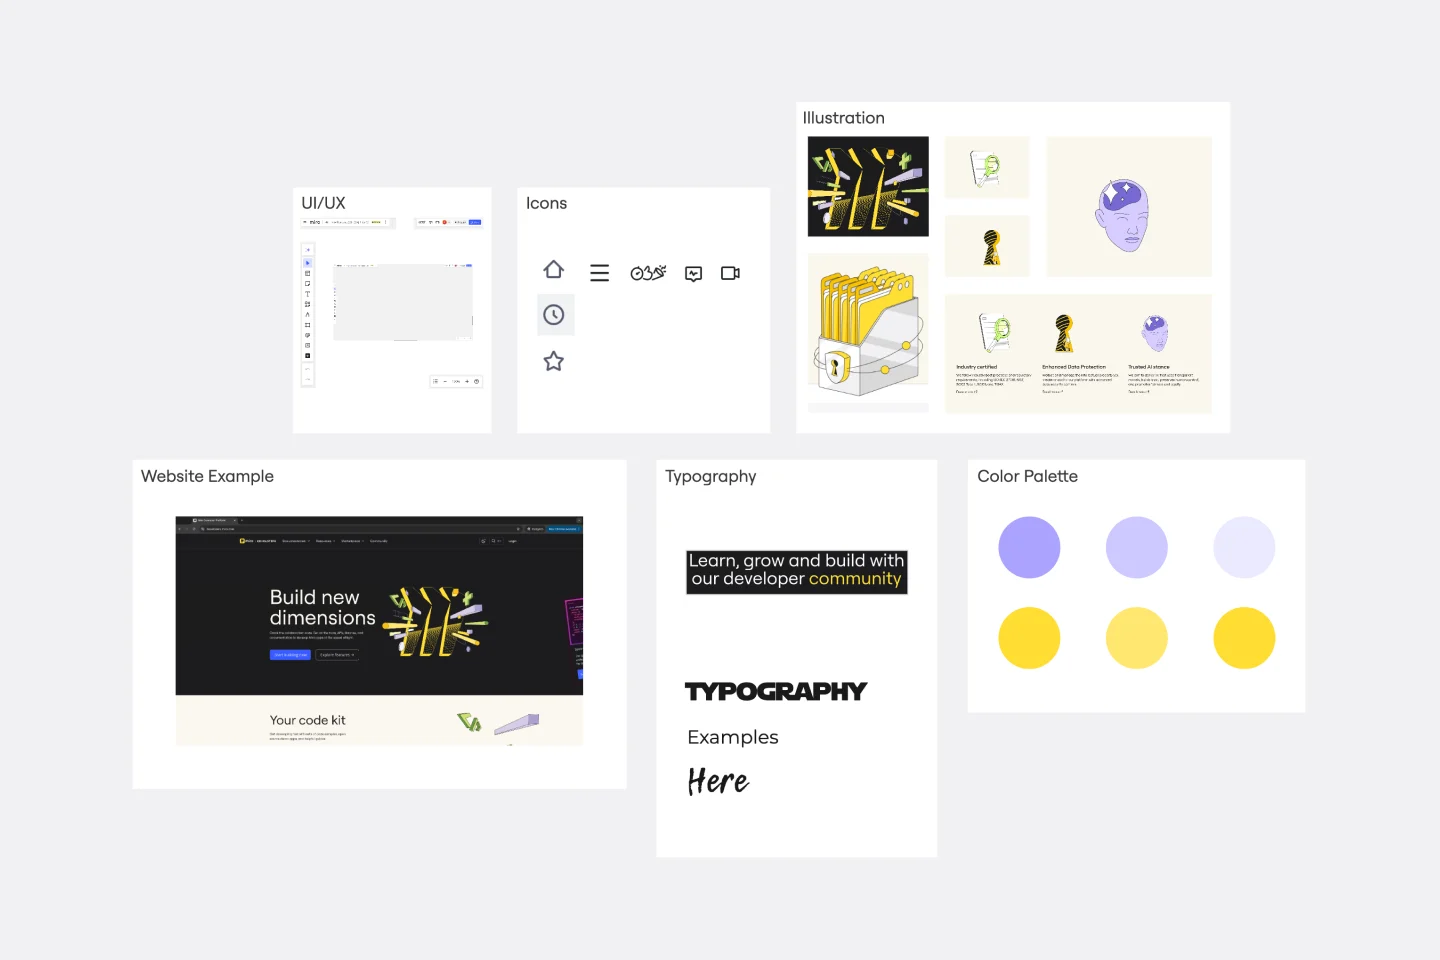
Mood Board Template
Works best for:
Design, Brainstorming, Ideation
When you’re kicking off a creative project, it’s sometimes important to communicate the mood you’re trying to evoke — but it’s so hard to do it with words. So create a mood board and use images, color palettes, textures, and typography. Mood boards are also perfect for gathering inspiration and sketching out and pitching ideas, and they’re not just for designers — your content writers, sales teams, and product teams can use them too, and this template makes it easy for all of you to get started.
Four-Circle Venn Diagram
Works best for:
Venn Diagram
The Four Circle Venn Diagram template is designed for comparing four sets of data. Use this tool to identify commonalities and differences across multiple categories. This template is ideal for complex data analysis, strategic planning, and academic research. It helps you visually organize information, making it easier to understand and communicate insights. Perfect for educators, researchers, and professionals in need of detailed comparison tools.
Ansoff Matrix Template
Works best for:
Leadership, Operations, Strategic Planning
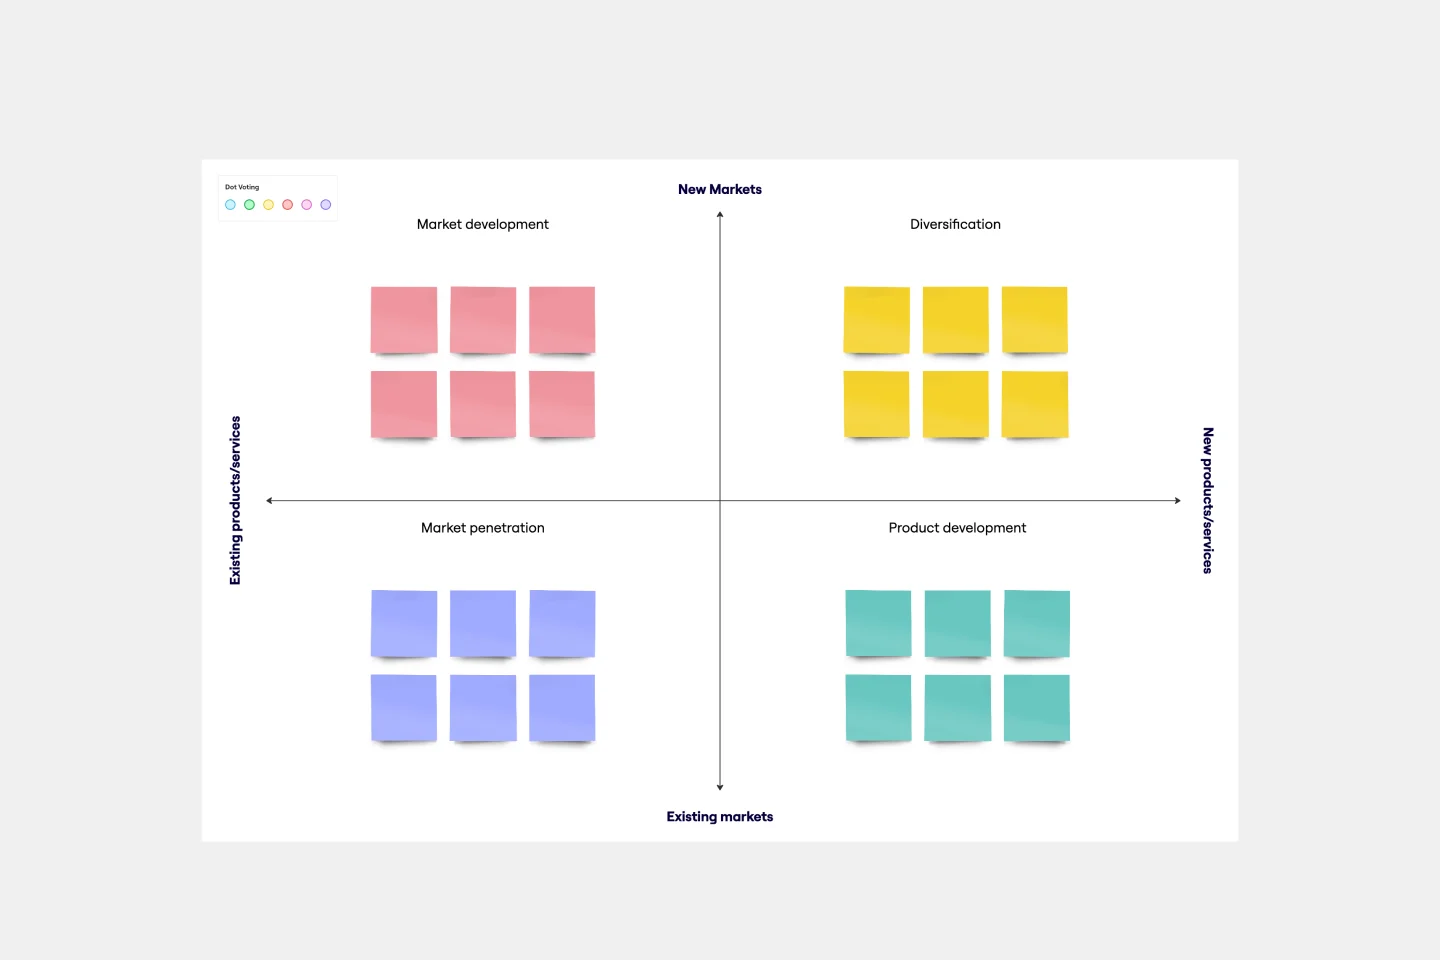
Keep growing. Keep scaling. Keep finding those new opportunities in new markets—and creative new ways to reach customers there. Sound like your approach? Then this template might be a great fit. An Ansoff Matrix (aka, a product or market expansion grid) is broken into four potential growth strategies: Market Penetration, Market Development, Product Development, and Diversification. When you go through each section with your team, you’ll get a clear view of your options going forward and the potential risks and rewards of each.
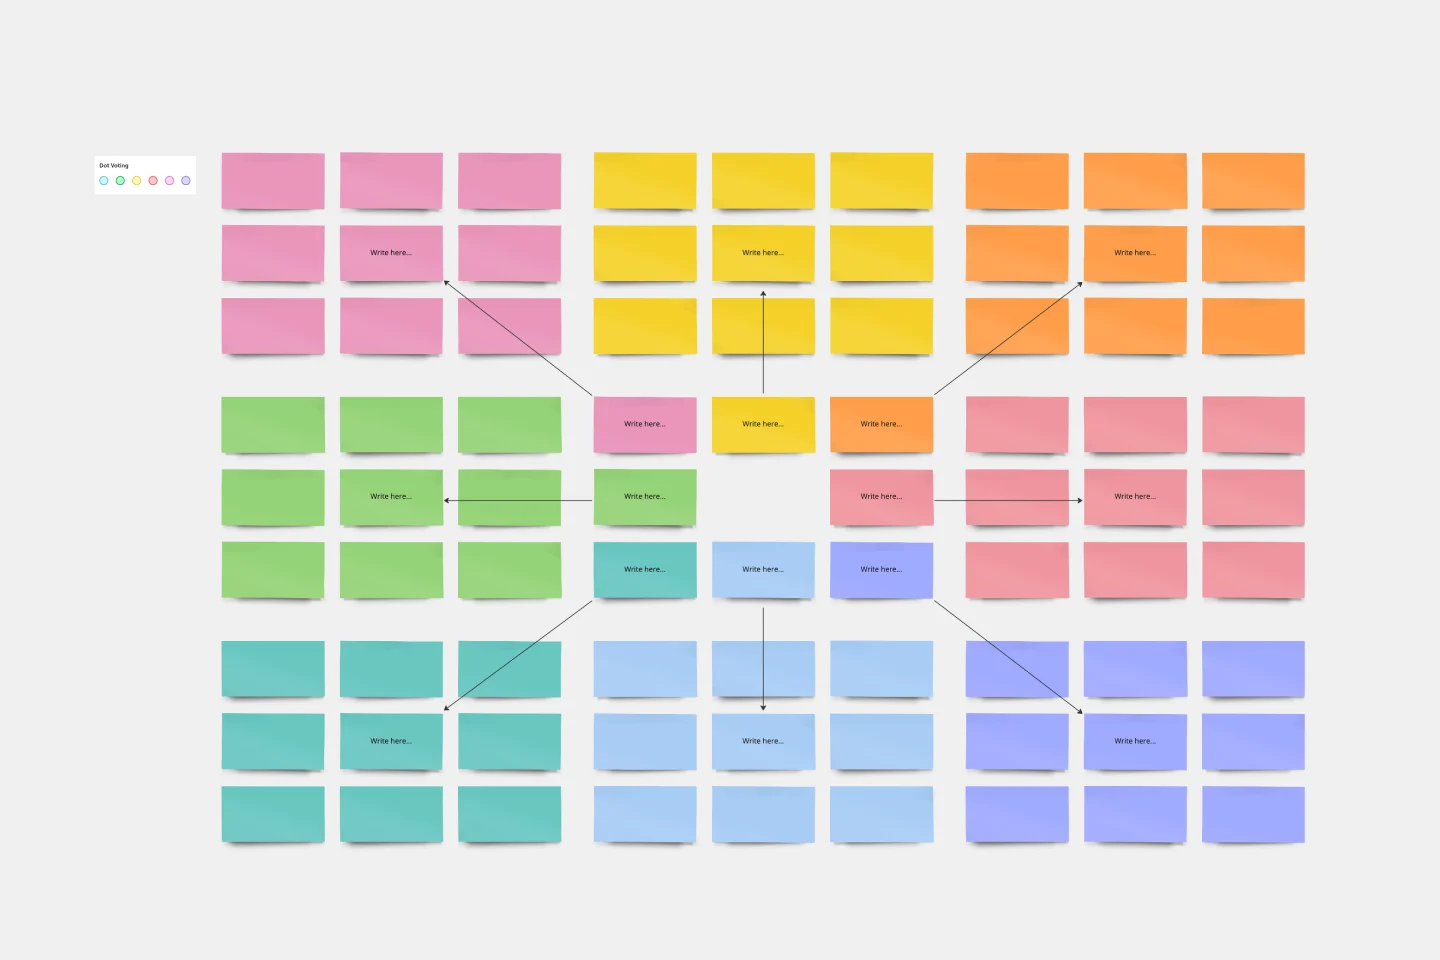
Crazy Eights Template
Works best for:
Design Thinking, Brainstorming, Ideation
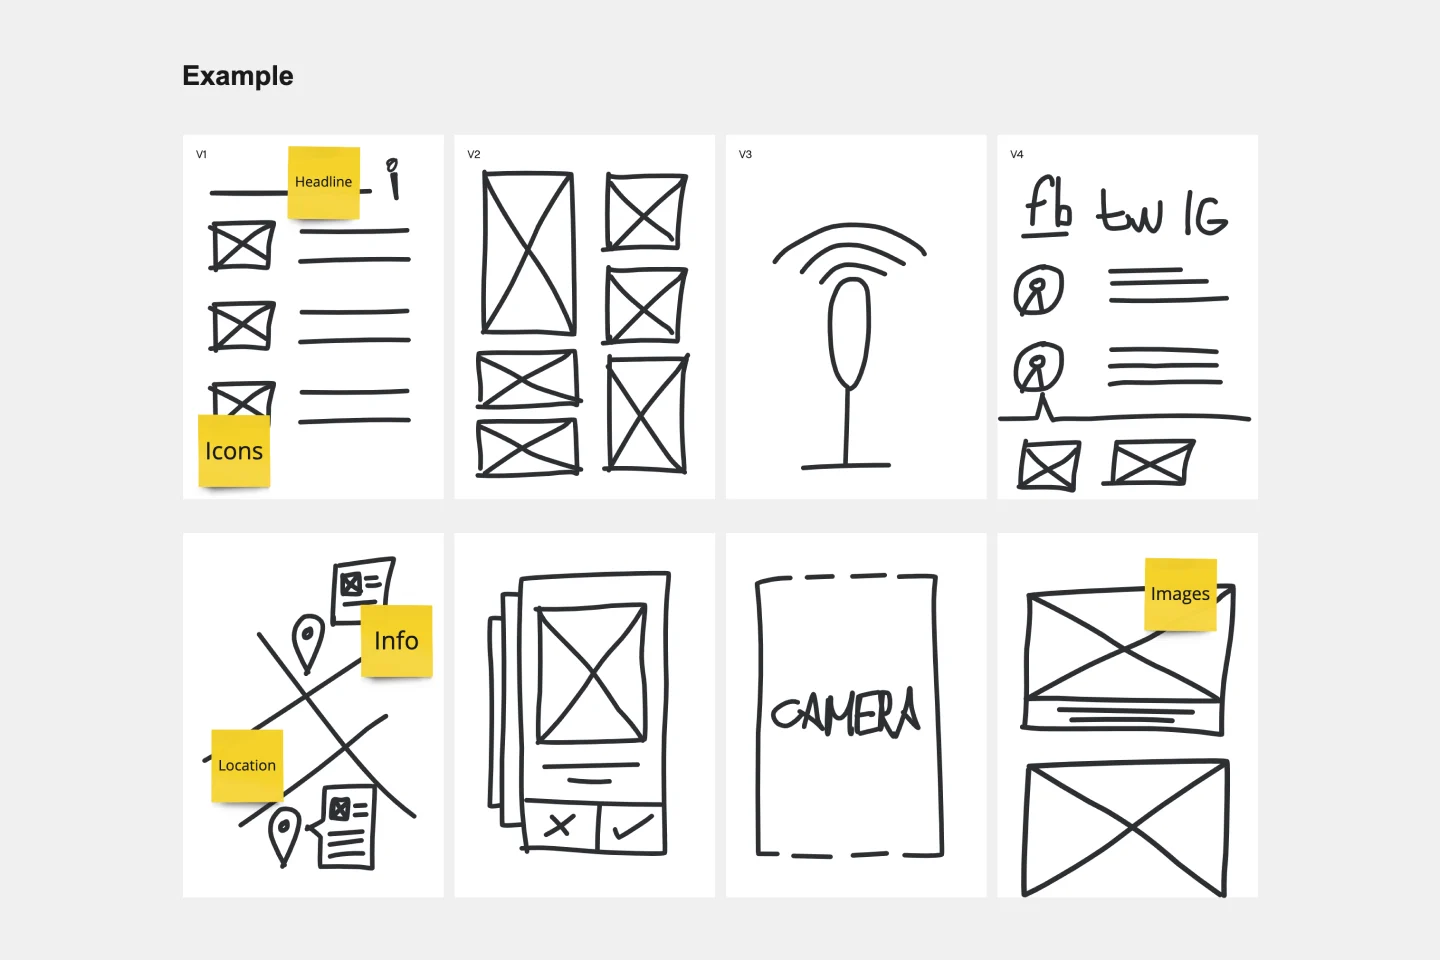
Sometimes you just need to get the team’s creative juices flowing for a brainstorm—and get them thinking of as many ideas as they can, as fast as they can. Crazy Eights will do it in a hurry. Favoring quantity over quality, this sketch brainstorming exercise challenges them to come up with eight ideas in eight minutes, which leaves no time to second guess ideas. It’s perfect for early stages of development, and it’s a team favorite for being fast paced and fun.